Download
1 / 16
160 likes | 418 Views
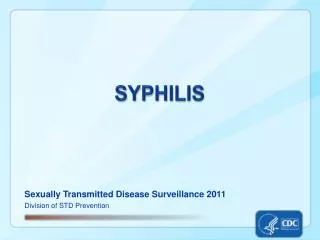
Syphilis. Syphilis—Reported Cases by Stage of Infection, United States, 1941–2011. 2011-Fig 36. SR. Primary and Secondary Syphilis—by Sex and Sexual Behavior, 33 Areas*, 2007–2011.

E N D
Syphilis—Reported Cases by Stage of Infection, United States, 1941–2011 2011-Fig 36. SR
Primary and Secondary Syphilis—by Sex and Sexual Behavior, 33 Areas*, 2007–2011 *32 states and Washington, DC reported sex of partner data for ³70% of cases of P&S syphilis for each year during 2007-2011. †MSM=men who have sex with men; MSW=men who have sex with women only. 2011-Fig 37. SR
Primary and Secondary Syphilis—Rates by Sex and Male-to-Female Rate Ratios, United States, 1990–2011 2011-Fig 38. SR
Primary and Secondary Syphilis—Rates by Region, United States, 2002–2011 2011-Fig 39. SR
Primary and Secondary Syphilis—Rates by State, United States and Outlying Areas, 2011 NOTE: The total rate of primary and secondary syphilis for the United States and outlying areas (Guam, Puerto Rico, and Virgin Islands) was 4.5 per 100,000 population. 2011-Fig 40. SR
Primary and Secondary Syphilis—Rates by County, United States, 2011 NOTE: In 2011, 2,154 (68.5%) of 3,142 counties in the United States reported no cases of primary and secondary syphilis. 2011-Fig 41. SR
Primary and Secondary Syphilis—Rates by Age and Sex, United States, 2011 2011-Fig 42. SR
Primary and Secondary Syphilis—Rates by Age Among Women Aged 15–44 Years, United States, 2002–2011 2011-Fig 43. SR
Primary and Secondary Syphilis—Rates by Age Among Men Aged 15–44 Years, United States, 2002–2011 2011-Fig 44. SR
Primary and Secondary Syphilis—Rates by Race/Ethnicity, United States, 2002–2011 2011-Fig 45. SR
Primary and Secondary Syphilis—Reported Cases* by Stage, Sex, and Sexual Behavior, United States, 2011 *Of the reported male cases of primary and secondary syphilis, 17.0% were missing sex of sex partner information. †MSM=men who have sex with men; MSW=men who have sex with women only. 2011-Fig 46. SR
Primary and Secondary Syphilis—Reported Cases* by Sex, Sexual Behavior, and Race/Ethnicity, United States, 2011 *Of the reported male cases of primary and secondary syphilis, 17.0% were missing sex of sex partner information; 2.4% of sex partner data were missing race/ethnicity data. †MSW=men who have sex with women only; MSM=men who have sex with men; 2011-Fig 47. SR
Primary and Secondary Syphilis—Reported Cases by Reporting Source and Sex, United States, 2002–2011 2011-Fig 48. SR
Primary and Secondary Syphilis—Percentage of Reported Cases* by Sex, Sexual Behavior, and Selected Reporting Sources, 2011 *Of the reported male cases of primary and secondary syphilis, 17.0% were missing sex of sex partner information; 3.9% of sex partner data were missing race/ethnicity data. †HMO=health maintenance organization; MSW=men who have sex with women only; MSM=men who have sex with men 2011-Fig 49. SR
Congenital Syphilis—Reported Cases Among Infants by Year of Birth and Rates of Primary and Secondary Syphilis Among Women, United States, 2002—2011 * CS=congenital syphilis; P&S=primary and secondary syphilis. 2011-Fig 50. SR