Download
1 / 15
180 likes | 423 Views
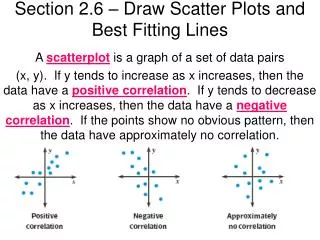
4-5 Scatter Plots and Lines of Best Fit. Goals: Write a linear equation that approximates a set of data points Determine if there is a positive, negative or no correlation between data points. Vocabulary. Data – collection of numbers or pairs of numbers to be analyzed.

E N D
4-5 Scatter Plots and Lines of Best Fit Goals: Write a linear equation that approximates a set of data points Determine if there is a positive, negative or no correlation between data points.
Vocabulary Data – collection of numbers or pairs of numbers to be analyzed. Scatterplot - a graph of pairs of numbers that represent a real-life situation.
Vocabulary • Best Fitting Line - line that is the best approximation of where the points lie. • Other terms for Best Fitting Line: • Line of Best Fit • Regression Line • Trend Line
Vocabulary • Correlation– the relationship between the inputs and the outputs. • Other term for correlation: • Trend • Types of correlation: • Positive • Negative • None
Positive Correlation Line of best fit has a positive slope Points are increasing from left to right
Negative Correlation Line of best fit has a negative slope Points are decreasing from left to right
Relatively No Correlation Line of best fit cannot be drawn Points are scattered
Example The graph shows the average number of students per computer in Maria’s school. Determine whether the graph shows a positive correlation, a negative correlation, or no correlation. If there is a positive or negative correlation, describe its meaning in the situation. The graph shows a negative correlation. Each year, more computers are in Maria’s school, making the students-per-computer rate smaller.
The graph shows the number of mail-order prescriptions. Determine whether the graph shows a positive correlation, a negative correlation, or no correlation. If there is a positive or negative correlation, describe it. A. Positive correlation; with each year, the number of mail-order prescriptions has increased. B. Negative correlation; with each year, the number of mail-order prescriptions has decreased. C. no correlation D. cannot be determined
How to find the Equation of the Line of Best Fit Draw the scatter plot of the data. Sketch the line of best fit. Pick 2 points on the line. Find the slope. Find the y-intercept. Write the equation of the line.
Let’s look at an example Discus Throws
Example y = -0.05 x + 15.85 The table shows the amount of sleep a baby needs at each age. Make a scatter plot of the data and find the equation of the line of best fit.
Practice The table shows the largest vertical drops of nine roller coasters in the US and the number of years after 1988 that they were opened. Make a scatterplot and find the equation of the line of best fit. y = 15x + 120
Homework Page 250 #1-7 for #3 only complete parts a-c.