Forecasting the Weather
Forecasting the Weather. What is it ??. A weather forecast is a PREDICTION of weather conditions over the next 3-5 days A METEROLOGIST is a person who observes and collects data on atmospheric conditions to make weather conditions. Technology.

Forecasting the Weather
E N D
Presentation Transcript
What is it ?? • A weather forecast is a PREDICTION of weather conditions over the next 3-5 days • A METEROLOGIST is a person who observes and collects data on atmospheric conditions to make weather conditions
Technology • Meteorologists need to measure various atmospheric conditions : air pressure, humidity, precipitation, temperature, wind speed, and wind direction • Weather Balloon
Technology • Thermometer- tool used to measure temperature • Barometer- instrument used to measure air pressure • Anemometer- instrument used to measure wind speed
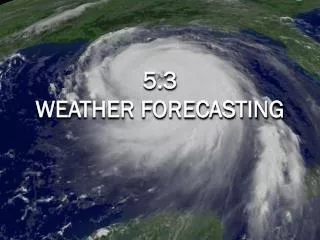
Radar and Satellites • Radar is used to find location, movement, and amount of precipitation • Using Doppler radar meteorologists can predict a tornado up to 20 minutes before it touches the ground
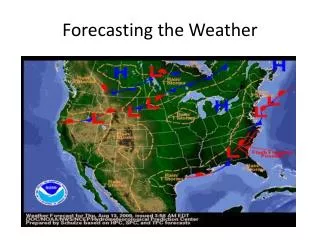
Weather Maps • In the U.S., the national weather service ( NWS), and the national oceanic& atmospheric administration ( NOAA) collect and analyze data • The NWS produces weather maps based on 1,000 weather stations across the U.S. • On these maps, each station is represented by a station model
Reading a Weather Map • Weather maps that you see on TV include lines called isobars. Isobars are lines that connect points of equal air pressure. Isobars that form closed circles represent areas of high or low pressure. These areas are usually marked on a map with a capital H or L. Fronts are also labeled on weather maps