Download

1 / 42
440 likes | 551 Views
Discover the intricate world of weather forecasting using sophisticated methods and cutting-edge tools. From the acquisition of weather information to prediction techniques, explore how meteorologists utilize data from satellites, radar, and land-based stations to generate accurate forecasts. Delve into the processes of numerical weather prediction, satellite observations, and the movement of weather systems using surface charts. Gain insights into the advancements that have revolutionized the field of meteorology and improved forecast accuracy.

E N D
Acquisition of Weather Information 10,000 land-based stations, hundreds of ships and buoys; four times a day, airports hourly Upper level: radiosonde, aircraft, satellites United Nations World Meteorological Organization, 175 countries World Meteorological Centers: Melbourne, Moscow, Washington D.C. NCEP, US NWS ASOS
Weather Forecasting Tools • Topics: Watches, Warnings, and Advisories • Advisories: potential hazardous conditions; wind, wind chill, heat, urban and small stream, snow, dense fog (likely) • Watch: atmospheric conditions favoring hazardous weather over a region in time, actual location and time not known; flash flood, severe thunderstorm, tornado, hurricane (more likely) • Warning: imminent or occurring hazardous weather over a region in time; high wind, heat, flash flood, severe storm, tornado, hurricane, winter storm, blizzard, gale, storm (very likely)
Weather Forecasting Tools High speed data modeling systems (AWIPS): communication, storage, processing, and display Doppler radar Satellite imagery Forecast charts Soundings Meteograms Wind profiles
Weather Forecasting Tools • Satellite Observations • Geostationary, polar orbiting • Visible light provides a black and white picture of clouds • Infrared approximates cloud temperature which infers height • Satellites measure many other variables: sea surface temperatures, ozone, upper level features, snow cover, land cover
Weather Forecasting Methods • 1950s maps, charts plotted by hand • Numerical weather prediction • Solves equations using gridded data • Final chart called analysis • 24 hr forecast for the N Hemisphere requires millions of calculations • Resolution • Guidance/ rules of thumb
Weather Forecasting Methods • Why Forecasts Go Awry • Assumptions • Models not global • Regions with few observations • Cannot model small-scale features • All factors cannot be modeled • Ensemble Forecasts: • Spaghetti model, robust • Observation: Weathercasters • Chroma key or color separation
Weather Forecasting Methods • Other Forecasting Techniques • Persistence • Trend • Analogue • Statistical • Weather type • Climatological
Weather Forecasting Methods • Types of Forecasts • Now cast <6 hrs • Short range 12-65 hrs • Medium range 3-8.5 days • Long Range >8.5 days • Accuracy and Skill • 12-24 hrs most accurate, 2-5 days good • Skill = more accurate than a forecast utilizing persistence of climatology
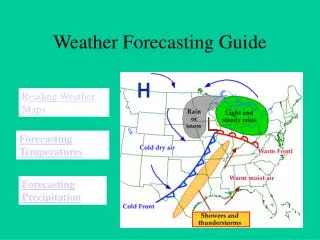
Weather Forecasting Using Surface Charts Movement of Weather Systems • Mid-lat cyclones move in same direction and speed as previous 6 hrs • Lows move in direction parallel the isobars in the warm air ahead of the cold front • Lows move toward region of greatest pressure drop
Weather Forecasting Using Surface Charts • Forecast Data collected… • Augusta GA • Washington DC • Chicago • Memphis • Dallas • Denver
Stepped Art Fig. 9-22, p. 267
Isobars • Isobars: lines of constant pressure • A line drawn on a weather map connecting points of equal pressure is called an isobar
El Nino & La Nina • Affects sea surface temperature in the equatorial Pacific Ocean-El Niño is characterized by unusually warm temperatures and La Niña by unusually cool temperatures • A strong El Niño is often associated with wet winters over the southeastern US, as well as drought in Indonesia and Australia • A strong El Niño can last a year or more before conditions return to normal and can occur every 3 to 7 years