Download

1 / 18
230 likes | 3.97k Views
Weather Forecasting. Chapter 14. Analysis to Prognosis. Three important forecasting steps are: 1) Assess the present state, called the analysis, 2) Predict a future state by running a computer model of weather changes

E N D
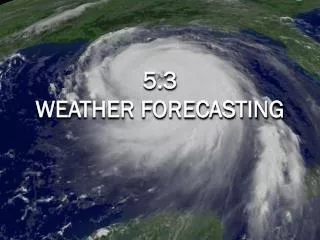
Weather Forecasting Chapter 14
Analysis to Prognosis Three important forecasting steps are: 1) Assess the present state, called the analysis, 2) Predict a future state by running a computer model of weather changes 3) Interpret the model results, called a prognostic chart, given forecasting experience
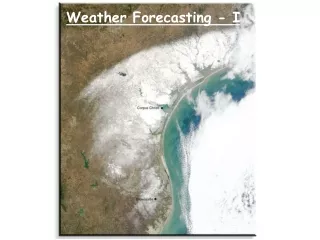
Viewing Data with AWIPS Viewing weather images, overlays, and graphs in multiple windows is facilitated with the National Weather Service's Advanced Weather Interactive Processing System (AWIPS), which gathers data from the Automated Surface Observing System among other sources.
WSR-88D Doppler Radar Weather Surveillance Radar - 1988 Doppler, also known as next generation radar (NEXRAD), detects severe weather size, movement, and intensity. Data received by the NEXRAD unit are processed by algorithms to assist the forecaster in weather interpretation.
Meteogram Display Predicted trends in several weather variables are plotted for a 60 hour period on a meteogram. Patterns in variable response, such as rising pressure and a stop in precipitation, are readily observed.
Vertical Sounding Profile Radiosonde instruments attached to pilot balloons are launched twice daily to profile weather variables with height. These January 14, 1999 data show winds veering from easterly at the surface to southwesterly aloft that may change the freezing rain in the saturated lower atmosphere to non-freezing rain.
Probability Forecasts Climate records, often 30 years of data, are used to generate probability forecasts for a given event. In this case, most of Texas has a less than 5% chance of snow on December 25th, while northern Minnesota has had snow on that date for each of the past 30 years.
Weather Forecasting Methods In this figure, the forecasting method is called weather types, which is a type of long range analogue forecast.
Weather Forecasting Methods • Persistence - the future will be like the present • Trend - the future will be like upwind weather • Analogue - the future will be like weather that historically occurred when similar conditions were present
Weekly & Monthly Forecasts Stationary weather systems often allow for trend based extended weather forecasts, while multiple runs of numerical weather models, known as ensemble forecasts, allow for 30 to 90 day outlooks.
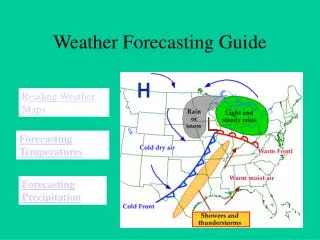
Forecasting with Surface Charts Many of the following figures analyze and predict weather for 6 U.S. cities. This simplified 6 AM Tuesday surface weather map is useful for short time interval predictions of fronts and associated weather.
Surface Chart Predictions 3-hour pressure tendencies plotted on isallobar maps help predict the movement of highs and lows and indicate how rapidly pressure systems are changing. Lows tend to move toward the region of greatest pressure fall, while highs move toward the region of greatest rise. The low from the previous map will likely move to the NE, while the high will move to the SE.
Upper Level Charts Figure 14.11 Upper level winds, particularly those at 5500 m, which is a common elevation for the 500 mb surface, often guide the path of surface pressure systems. These upper level winds, however, travel at nearly twice the speed as the surface systems. Here again, we see the low will head to the NE, while the high will head SE.
Observed Movement of Fronts Surface weather observations from 6 PM Tuesday and 6 AM Wednesday show how the fronts, pressure systems, and precipitation have moved as predicted.