Mapping: Topo and Contour Maps
140 likes | 180 Views
Learn how to read and create maps based on latitude and longitude, with a focus on topographic and contour maps. Explore contour lines representing elevation, interpreting gradients, and drawing map profiles. Understand key rules and features of contour maps to navigate wilderness terrain effectively.

Mapping: Topo and Contour Maps
E N D
Presentation Transcript
O.K. ~ • Now that we’re experts on latitude and longitude; how can we use them? • We use latitude and longitude as a basis to create and read maps.
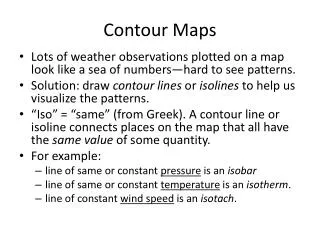
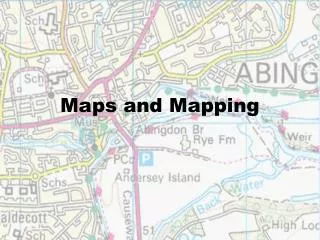
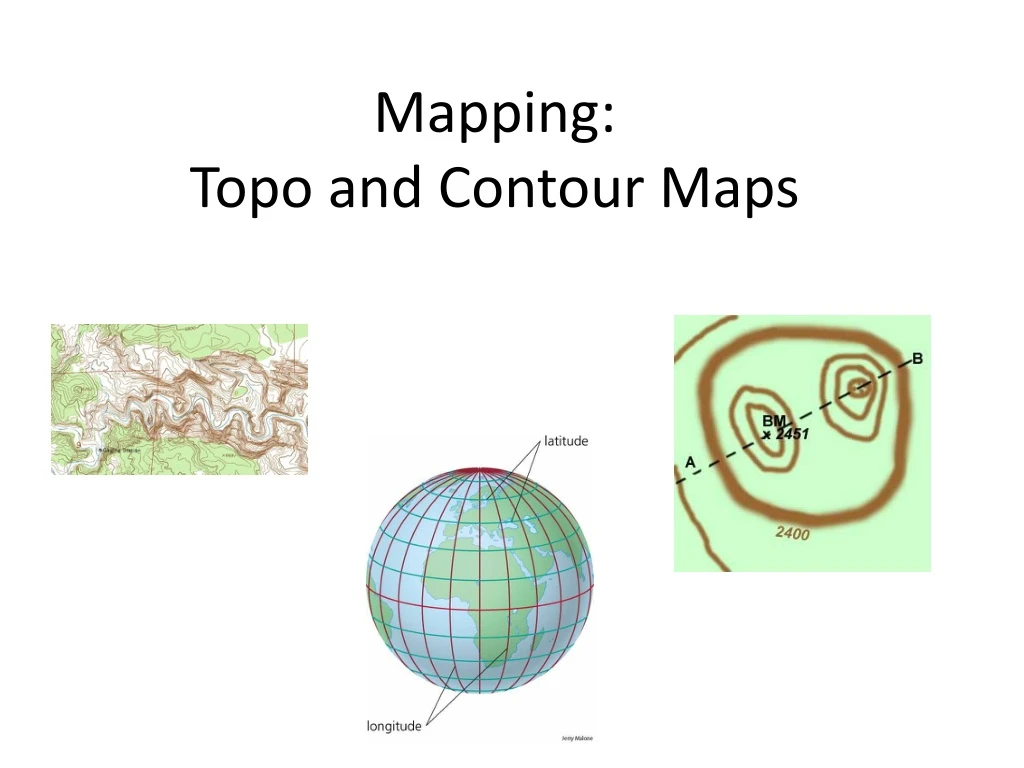
Maps come in many shapes and sizes . . . • Globes – Round maps • Highway Maps – flat, no geologic features • Topograhic Maps – Shows landforms on a flat surface through the use of contour lines.
Contour Maps/Topo Maps • A Contour Map is a topographic map that represents Earth’s surface features through the use of isolines – lines that connect points of equal elevation. • Topography : Surface features of an area (both natural and man-made) • Topo maps are flat maps that use contour lines and symbols to represent land features.
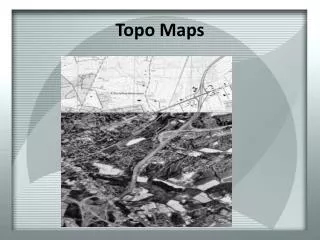
A topo (topographic) map is a map that shows elevation. It’s THE map to bring when going wilderness hiking. • **Contour lines show elevation above or below sea level. • **Contour Interval is the amount of elevation change between contour lines. • ** Contour lines will never intersect because they represent different elevations; there cannot be two elevations at any given point.
Contour lines and streams: • **When a contour line crosses a stream, it always points upstream. [This makes sense, because a streambed is at a lower elevation than the land it crosses. Therefore, the contour line must travel upstream to find a point of equal elevation in the stream’s bed.]
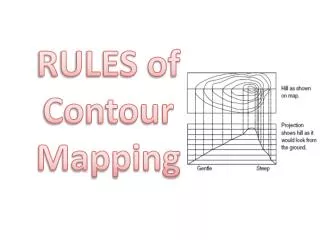
Rules of contour lines: • **The closer together the contour lines the steeper the slope; the farther apart they are, the more gentle the slope. • Contour lines (or any other isolines for that matter) don't cross or branch with another contour line, ever. • Where contour lines make a bull's eye (a series of concentric circles), there is a hill top. -- Unless there is a benchmark [] or an [x], indicating the actual elevation of a hill, you cannot determine the exact elevation of the hill’s highest point from the contour lines.
More on contour lines . . . • When a contour line crosses a stream/river, it makes a ‘V’. The point of the V always points the opposite way a stream is flowing. **So, we can determine the direction a stream is flowing by noting the direction the contour lines are pointing. • Hachured Contour lines occur when there is a negative change in elevation which indicates a depression or valley.
Calculating the Gradient of a slope: • The slope or gradient is the rate of change from place to place. • You can estimate the gradient by observing the isolines • Close together = steep gradient [cliff, mountain] Far apart = gentle gradient [field, plain] GENTLE STEEP
The formula is as follows: (difference in elevation between two points) Change in field value Distance (How far apart the points are, usually miles) • The units for gradient are feet/mile OR m/km
Rules for drawing profiles: • Draw/find a straight line through a landform with a point at both ends. • Put a blank piece of paper along that line from point to point and mark off the starting and ending points and every point that a contour line crosses. • Using your now plotted paper, place it on the x-axis of a graph where the y-axis is scaled using the contour interval given to you on the map.
More rules . . . • Mark the elevations directly above each mark you made in step #2 using a point. • Connect the points with a fluid line to show a side view of the landform. • Voila! You have a map profile!
So, in conclusion to our Contour Lines (hint, hint) • In order to draw a topo/contour map, we need to have the following data: • Accurate measurement of latitude/longitude • A plethora of elevation points • contour/isolines connecting those points