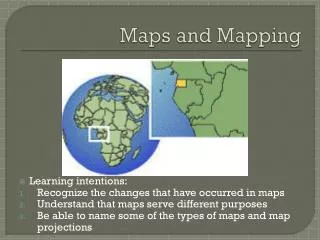
Maps and Mapping
Maps and Mapping. Determining Location. Latitude Lines that run horizontally Measured in degrees North and South of the Equator. Longitude Lines that run vertically Measured in degrees East or West of the prime meridian. II. Mercator Projection Map. Gerardus Mercator

Maps and Mapping
E N D
Presentation Transcript
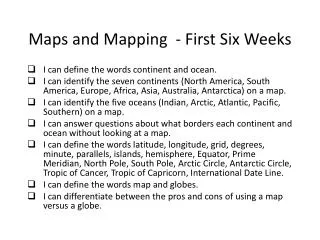
Determining Location • Latitude • Lines that run horizontally • Measured in degrees North and South of the Equator. • Longitude • Lines that run vertically • Measured in degrees East or West of the prime meridian.
II. Mercator Projection Map • Gerardus Mercator • Created to help sailors navigate around the Earth • Lines of latitude are further apart near the equator • Accurate directions
III. Gnomonic Projection map • Made by placing a piece of paper on a globe so that it touches a single point on the globes’ surface • Shows the greatest accuracy of shortest distance between 2 points
IV. Topographic Maps • Represents the Earth’s 3-dimensional surface in 2 dimensions a. Contour lines- a line that shows elevation * contour interval- tells the difference in elevation between 2 contour lines *contour lines forming a circle represent a hill. 1. lines close together- steep slope 2. lines further apart – gentle slope 3. depression-represented by circular contours that have hachure marks
Streams • The direction a streams is flowing is shown on a topographic map by the way a contour line crosses the stream. • Streams are shown as a blue line on maps. • When contour lines cross a stream it looks like an upside down V. • The point in the V points upstream. It opens in the direction the water is flowing