Download
1 / 38
380 likes | 533 Views
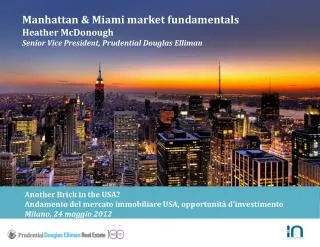
Manhattan & Miami market fundamentals Heather McDonough Senior Vice President, Prudential Douglas Elliman. Another Brick in the USA? Andamento del mercato immobiliare USA, opportunità d’investimento Milano, 24 maggio 2012. Prepared by. Company Overview & Marketing Capabilities Presentation.

E N D
Manhattan & Miami market fundamentals Heather McDonough Senior Vice President, Prudential Douglas Elliman Another Brick in the USA? Andamento del mercato immobiliare USA, opportunità d’investimento Milano, 24 maggio 2012 Prepared by Company Overview & Marketing Capabilities Presentation
TABLE OF CONTENTS I. Macro Economics Factors II. The Manhattan Market III. The Miami Market Prepared by
MACRO ECONOMIC FACTORS • Historically Low Interest Rates • US Dollar Attracting International Purchasers • Low Foreclosure Rates Prepared by
HISTORICALLY LOW INTEREST RATES Prepared by
US DOLLAR ATTRACTING INTERNATIONAL PURCHASERS USD/€ Exchange Rate Over 6 Months Nov 4, 2011 – May 1, 2012 Source: Oanda.com Prepared by
US DOLLAR ATTRACTING INTERNATIONAL PURCHASERS • Contributing to international purchasers decision making process on buying US properties are the concerns about the weakening Euro. • “2012 Predictions – The Euro will reach parity with the U.S. Dollar” – CNBC’s Brian Sullivan • With indications that the Euro is falling apart-- the crisis in Greece, poor economic conditions in Italy and Spain, the US is perceived as a safe and secure place to invest. • Despite global uncertainty, the US avoided succumbing into another recession and in 2011 GDP grew by 1.7%, producing nearly 1.6 million jobs. • According to DTZ Research, an estimated $329.0 billion in capital was raised to directly target global real estate in 2011, with 33.7 percent ($111.0 billion of capital funneled to the United States.) Prepared by
LOW FORECLOSURE RATES MARCH 2012 U.S. FORECLOSURE RATE HEAT MAP FORECLOSURE ACTIVITY COUNTS MARCH 2012 California 45,122 Florida 26,758 Texas 8,228 New York 2,151 NY, NY 52 Total number of households receiving foreclosure filings during the month. Source: RealtyTrac.com Prepared by
NEW YORK CITY NEIGHBORHOODS • KEY MANHATTAN SUBMARKETS • Upper East Side • Upper West Side • Midtown • Downtown • West Village • Tribeca • SoHo • Flatiron • Chelsea • Financial District
MANHATTAN STABILITY FACTORS • World-Class City and Financial Epicenter • Undervaluation of NYC Properties • Diverse City with Fluid Population • Strong Demand Continues • Appeal of Investment Properties / Strength of Rental Market • Composition of Housing Stock • Restricted Future Supply VIII. Positive Outlook - Blue-chip Commodity IX. Emerging neighborhood
WORLD-CLASS CITY & FINANCIAL EPICENTER To gauge which cities are considered the most important to the world’s HNWIs, The Wealth Report surveyed Citi Private Bank’s wealth advisors around the world and Knight Frank’s global network of luxury property specialists. CITI POWER & NEW WORLD ORDER NEW YORK RANKS: ECONOMIC ACTIVITY #2 KNOWLEDGE & INFLUENCE #2 QUALITY OF LIFE #3 POLITICAL POWER #3 MOST IMPORTANT GLOBAL CITY #2
UNDERVALUATION OF NYC PROPERTIES AVERAGE PRICES 4Q 2011 Currency calculations based on rate prevailing on 12/31/2011 Source: Knight Frank’s Prime International Residential Index
UNDERVALUATION OF NYC PROPERTIES • As noted previously, NYC ranks as the #2 City for Economic Activity, Knowledge & Influence and Global Importance & #3 for Political Power and Quality of Life. • With this in mind, it is shocking to see Manhattan ranking #17 at €18,000/SM ($2,200/SF). This pricing is actually the top 2% of the luxury segment as the average price per square foot in Manhattan in 1st Quarter of 2012 was actually approx. $1,086/SF or €9,222/SM. • The latest update of The Economist’s global house-price indicators reveal that New York properties are currently undervalued, providing incredible mid-long run investment opportunities. “Fair value” is defined in terms of long-run average of 2 measures: the price-to-income ratio (gauge of affordability) and the price-to-rents ratio (gauge of equity value).
DIVERSE CITY WITH FLUID POPULATION • 2011 Census New York City Key Findings: • Estimated Population 2011: 8,175,133 (YTY 2.1% growth) • Foreign Born Persons: 36.8% • Language Other than English Spoken at Home: 48.3% • Demographic: White (44.0%, Black 25.5%, American Indian 0.7%, Asian 12.7%, Hawaiian 4.0%, Hispanic/Latino 26.6%, Multi-race 4.0%) • Home to more than 800 Languages
DIVERSE CITY WITH FLUID POPULATION • Constant Movement in the Market Despite Prevailing Economic Conditions • Financial services sector constantly moving in and out from broad. • High percentage of international buyers interested to relocate, purchase second homes/investment properties, family home to send children to university • Life happens– Marriage, Divorce, Expanding Families, Empty Nesters
STRONG DEMAND CONTINUES MANHATTAN CONDOS Source: Elliman 2002-2011 Report
STRONG DEMAND CONTINUES • Some market segments out performing 2007-2008 levels: 166 Perry, Unit 2C: 2010 Sold Price: $2.215m 2012 Sold Price: $3m (35% gain) (Our sale) 7 Hubert Street: Unit 7A: 2007 Sold Price: $4.25m 2010 Sold Price: $7.5m (76.5% gain) 15 Central Park West PH20: 2007 Sold Price: $43.7m 2012 Sold Price: $88m (101% gain) 28D: 2008 Sold Price: $8.98m 2012 Sold Price: $21m (134% gain) II. Transaction Volume • 2011 – 10,161 Transactions (6.9% increase) • 2002 – 9,509 Transactions
APPEAL OF INVESTMENT PROPERTIES / STRENGTH OF RENTAL MARKET • Rental Vacancy and Average Rents • Vacancy rates remain low hovering around 1%. • In the first quarter of 2012 the average rental price per square foot of $52.57 has reached its highest level since the credit crunch began in the third quarter of 2008. Source: Miller Samuel
APPEAL OF INVESTMENT PROPERTIES / STRENGTH OF RENTAL MARKET Source: Miller Samuel
COMPOSITION OF HOUSING STOCK • 62% of the housing stock in Manhattan is rental inventory and 38% is privately owned Condo & Co-op. • Of the 38% that is privately owned, a large percentage is rented making the actual percentage of residents renting in Manhattan somewhere between 70-75%. This is the largest rental to own ratio in the country.
COMPOSITION OF HOUSING STOCK CO-OP & CONDO • CO-OP • In NYC, 85% of all apartments for purchase are co-op (almost ALL prewar apartments are co-op) • You don't own any REAL PROPERTY, you own shares in corporation that owns the building • Advantages: Less expensive, percentage of maintenance fees are tax deductible • Disadvantages: Prospective purchasers and renovations must be "board approved," generally higher down payments required, limitations on subletting/renting, restrictions on pied-a-terres and parents buying for children CONDO • Condos are REAL PROPERTY, with its own deed and tax bill • Advantages: Greater flexibility, financing restrictions less stringent, less red tape for board approvals, few limitations on renting/subleting, lower monthly maintenance fees, some condos have tax abatements • Disadvantages More expensive, monthly maintenance fees are not tax deductible
RESTRICTED FUTURE SUPPLY MANHATTAN ACTIVE VS. PENDING LISTINGS 1/1/2008 to 5/1/2012 Source: UrbanDigs.com
RESTRICTED FUTURE SUPPLY • Low Level of Inventory • 2011: 7,221 Active Listings • 2001: 7,506 Active Listings • Manhattan is an Island so no room for growth • Not many development sites left to build • New Building Applications in Manhattan Recorded by the Department of Buildings (DOB): 1/2011: 4 1/2010: 2 1/2009: 2 1/2008: 18 1/2007: 17 1/2006: 24
POSITIVE OUTLOOK / BLUE-CHIP COMODITY “Manhattan housing prices and sales activity have remained stable for the past three years, despite the general economic turbulence” - ELLIMAN 2002-2011 DECADE REPORT
EMERGING NEIGHBORHOODS LOWER MANHATTAN • Lower Manhattan’s total inventory 28,775 units in 316 buildings • 6 additional buildings are in the pipeline and scheduled for completion by 2013 • Population grew in 2011 to an estimated 57,000 residents and is expected to reach 60,000 residents in 2012 and 61,600 in 2013 • Population is affluent and well educated. 85% have graduate degree and 42% have done post-grad work. Average household income is $188,000/yr.
EMERGING NEIGHBORHOODS DOWNTOWN CONDOS • Average Price Per Sq. Ft: $1,240 (2011) $635 (2002) 95.3% Chg • Number of Sales: 2,221 (2011) 1,380 (2002) 60.9% Chg
EMERGING NEIGHBORHOODS WEST VILLAGE/GREENWICH CONDOS • Average Price Per Sq. Ft: $1,642 (2011) $833 (2002) 97.1% Chg • Number of Sales: 156 (2011) 162 (2002) -3.7% Chg
EMERGING NEIGHBORHOODS SOHO/TRIBECA CONDOS • Average Price Per Sq. Ft: $1,379 (2011) $709 (2002) 94.5% Chg • Number of Sales: 377 (2011) 154 (2002) 144.8% Chg
EMERGING NEIGHBORHOODS FINANCIAL DISTRICT • Average Price Per Sq. Ft: $987 (2011) $478 (2002) 106.5% Chg • Number of Sales: 343 (2011) 7 (2002) 4800.0% Chg
EMERGING NEIGHBORHOODS CHELSEA CONDOS • Average Price Per Sq. Ft: $1,303 (2011) $639 (2002) 103.9% Chg • Number of Sales: 345 (2011) 190 (2002) 81.6% Chg
MIAMI NEIGHBORHOODS • KEY MIAMI SUBMARKETS • Miami Beach • Fisher Island • Downtown Miami • Key Biscayne • Brickell • Coconut Grove • Coral Gables • Bal Harbour • Sunny Isles • Aventura
MIAMI MARKET FUNDAMENTALS • World-Class City • Lat-Am Financial Gateway • International Component • Strong Demand Continues • Bargain Investment Properties • Strong Second Home Market • Restricted Future Supply VI. Positive Outlook
WORLD-CLASS CITY & FINANCIAL EPICENTER To gauge which cities are considered the most important to the world’s HNWIs, The Wealth Report surveyed Citi Private Bank’s wealth advisors around the world and Knight Frank’s global network of luxury property specialists. CITI POWER & NEW WORLD ORDER MIAMI RANKS: RICHEST CITY #4 MOST IMPORTANT CITY #6 QUALITY OF LIFE #9 KNOWLEDGE & INFLUENCE #16 POLITICAL POWER #17 ECONOMIC ACTIVITY #15
INTERNATIONAL COMPONENT • Miami-Dade County Census City Key Findings: • Estimated Population 2010: 2,496,435 • Foreign Born Persons: 51.1% • Language Other than English Spoken at Home: 71.9% Survey of Miami Realtors Concerning International Clients October 2011 • 83% of brokers have worked with an International client in the last 12 months
STRONG DEMAND CONTINUES MIAMI OVERALL MARKET Source: Elliman 2002-2011 Report
Heather McDonough Senior Vice President HMcDonough@elliman.com