
Uploaded by
dimaia
3 SLIDES
189 VIEWS
30LIKES
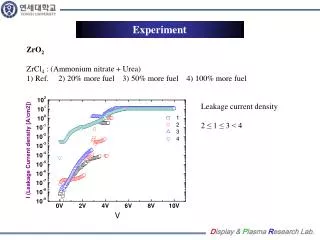
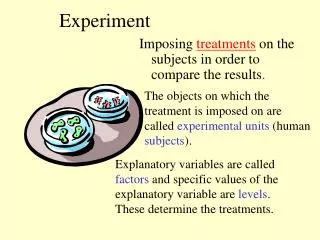
Experiment
DESCRIPTION
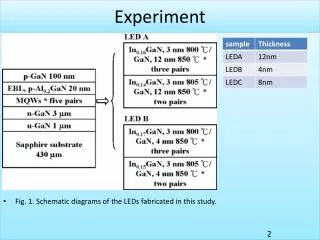
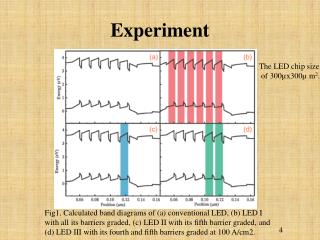
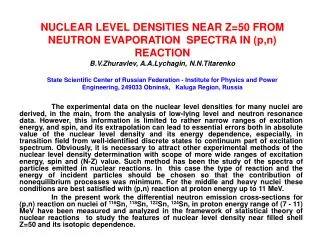
Experiment. Fig. 1. Schematic diagrams of the LEDs fabricated in this study. Results and Discussion. Shockley-Read -Hall Fig. 2. EQEs and forward voltages of InGaN / GaN LEDs featuring quantum barriers of various thicknesses, plotted with respect to the current density.
Download
1 / 3
Download Presentation 
Experiment
An Image/Link below is provided (as is) to download presentation
Download Policy: Content on the Website is provided to you AS IS for your information and personal use and may not be sold / licensed / shared on other websites without getting consent from its author.
Content is provided to you AS IS for your information and personal use only.
Download presentation by click this link.
While downloading, if for some reason you are not able to download a presentation, the publisher may have deleted the file from their server.
During download, if you can't get a presentation, the file might be deleted by the publisher.
E N D
Presentation Transcript
Experiment • Fig. 1. Schematic diagrams of the LEDs fabricated in this study. 2
Results and Discussion Shockley-Read -Hall • Fig. 2. EQEs and forward voltages of InGaN/GaN LEDs featuring quantum barriers of various thicknesses, plotted with respect to the current density. 3
Fig. 3. Simulated distributions of (a) hole concentration and (b) recombination rate for the LEDs with different barrier thicknesses. 4

More Related