Download
1 / 22
220 likes | 310 Views
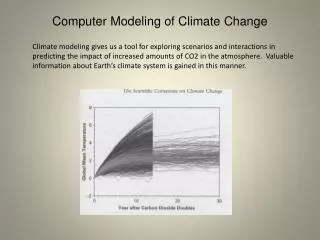
Understand the role of models in addressing climate change and crop management, using GOSSYM model to assess impacts on cotton yield, tillage, genetics, insect management, and educational applications.

E N D
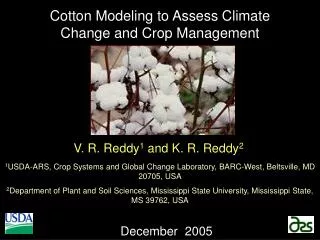
Cotton Modeling to Assess Climate Change and Crop Management V. R. Reddy1 and K. R. Reddy2 1USDA-ARS, Crop Systems and Global Change Laboratory, BARC-West, Beltsville, MD 20705, USA 2Department of Plant and Soil Sciences, Mississippi State University, Mississippi State, MS 39762, USA December 2005
Why Do We Need Models? • Provide quantitative description and understandingof biological problems. • Help pinpoint knowledge gaps. • Design critical experiments. • Synthesize knowledge about different componentsof a system. • Summarize data. • Transfer research results to users.
Demand for Models • Farm management (e.g. planting, irrigation, fertilization and harvest scheduling). • Resource management (e.g. several Govt. agencies and private comp. use). • Policy analysis. • Production forecasts (e.g. global, regional and local forecasts). • Research and development (e.g. research priorities and guide fund allocations). • Turning information into knowledge (e.g. information overflow in every area including agricultural research).
Timeline for Information Flow Identify knowledge void Months Conceptualize the experiment Months/Years Implementation Months/Years Months Analyze data Months Years Scientists Ext. Personnel Industry Reps Consultants Farmers Publication Crop model/DSS Months/Years Technology transfer Months Months/Years Farm decisions
GOSSYM: Model Structure GOSSYM DATES CLYMAT TMPSOL FERT FRTLIZ SOIL RAIN RUNOFF GRAFLO PIX ET CHEM PREP UPTAKE CAPFLO PNET NITRIF GROWTH RUTGRO RIMPED NITRO ABSCISE PLTMAP MATAL PMAP FREQ OUTPUT COTPLT For more details on model structure: Hodges et al., 1998
GOSSYM: Model Validation United States Greece Israel China • Continuous evolution of the model by extensive testing across diverse environments, soil conditions and cultural practices. • Information feedback from scientists, farmers and farm managers.
Climate Change – Cotton Yield Extreme Years Lint yield
Tillage and Erosion Studies • GOSSYM was used to evaluate the effects of erosion and erosion-related activities on lint yields. • GOSSYM was also used to investigate the effects of simulated tillage and wheel traffic on growth and yield.
Insect Damage Assessment • RbWHIMS: Rule-based Wholistic Insect Management System. • Provides information to the user for determining pesticide management strategies. • Recommendations include: extent of pest control,timing of pesticide application/no application and when to observe the field for future management strategies.
Genetics Improvement Research • GOSSYM – a tool to predict the effect and economic benefit of various genetic combinations. • Photosynthesis was found to be the limiting factor in the okra leaf-type cottons which have more number of bolls/plant and less lint yield than normal leaf-type cottons.
GOSSYM: Educational Applications • As a tool for learning: principles of crop and soil management. • As a classroom teaching tool: graphically presents the changes in plant growth and development. • Educating farm managers to improve their crop productivity. • Assist crop consultants in the decision making process. • 22 (15 Ph.D and 7 MS) theses on GOSSYM were accepted since 1979 at MSU. • GOSSYM served as a template to other crop models (melons, soybean, corn, wheat, rice and potato) at USDA.
GOSSYM: Model Applications Field Scale
Pre-season and In-season Decisions • Timely decisions can be taken by predictions with GOSSYM. • Helps in decision-making regarding leasing of farms. • Estimations before hand – fertilization and irrigation costs. • GOSSYM – for determining crop termination, nitrogen application, irrigation management.
GOSSYM: Reap Profits Farmer Plots GOSSYM Plots • In another study, GOSSYM plots had a profit of $100 - $350 ha-1(McKinion et al., 1989). • GOSSYM plots had a profit of $80 ha-1than farmer plots (Ladewig and Powell, 1992).
GOSSYM Deficiencies and Future Development Needs
Deficiencies and Future Needs Nutrients other than C and N? Fiber quality? GOSSYM Damage due to UV-B/pests/herbicides? Extreme weather, Hail? Winds? Modern/transgenic cottons?
Shall We Discuss! Thank You