Download
1 / 44
440 likes | 548 Views
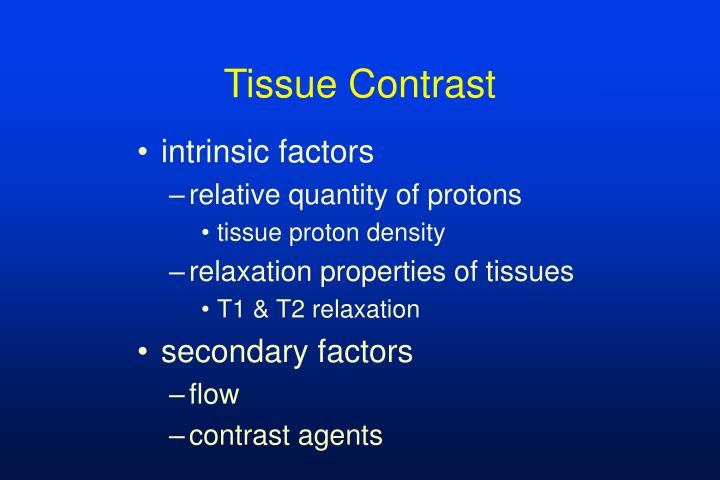
Tissue Contrast. intrinsic factors relative quantity of protons tissue proton density relaxation properties of tissues T1 & T2 relaxation secondary factors flow contrast agents. Contrast. the ability to discriminate different tissues based on their relative brightness. Basic Principle.

E N D
Tissue Contrast • intrinsic factors • relative quantity of protons • tissue proton density • relaxation properties of tissues • T1 & T2 relaxation • secondary factors • flow • contrast agents
Contrast • the ability to discriminate different tissues based on their relative brightness
Basic Principle • relatively intermediate intensity structures look bright on a dark background • important to remember with fatsat • relatively intermediate intensity structures look dark on a light background
Caveat • windowing affects the relative contrast of tissues • intensity values of pixels are relative to one another, unlike CT • windowing can make a solid tumor look like a “cyst”
“CYST” T2 FSE T1 SE
CYST? T2 FSE T1 SE
CYST? T2 FSE T2 FSE
Summary • need visible differences in intensity to discriminate tissues • surrounding tissues can make an intermediate signal tissue appear dark or bright • windowing affects image and tissue contrast
Noise • constant at a given machine setup • reduces the ability to visualize low contrast structures • adds to or subtracts from the average signal intensity of a given pixel
Noise • increasing the available signal will reduce the relative effects of noise • machine parameters must be chosen to maximize signal without significantly extending exam times • S/N is a relative measure allowing for comparison in a variety of circumstances
high signal high SNR low signal low SNR SI SI frequency frequency Signal versus Noise
Image Contrast 100% noise
Image Contrast 80% noise
Image Contrast 60% noise
Image Contrast 40% noise
Image Contrast 20% noise
Image Contrast 0% noise
Factors Affecting SNR • strength of main magnet • coil selection • voxel size • phase encoding • number of averages • receiver bandwidth • pulse sequence parameters
Factors INCREASING SNR • stronger main magnet • proper imaging coil • larger voxel size • decreased phase encoding • increased number of averages • decreased receiver bandwidth • (pulse sequence parameters)
linear increase less T1 weighting at high fields increased chemical shift effects in RO direction Stronger Main MagnetS/N effect Downside
Coil SelectionS/N effect Downside • increase in signal with surface coils • quadrature provides 40% increase S/N over linear • phased array increased over quadrature • limited coverage with surface coils • more complex coils are more expensive
Larger Voxel SizeS/N effect Downside • linear increase in either RO or PE direction • linear increase with increased slice thickness • decreased resolution
Decreased Phase EncodingsS/N effect Downside • square root increase in signal to noise • linear decrease in scan time • decreased resolution in PE direction • Gibb’s phenomenon in PE direction
Increased Signal AveragesS/N effect Downside • square root increase in signal to noise • linear increase in scan time
Decreased Receiver BWS/N effect Downside • square root increase in signal to noise • increase in chemical shift artifact in RO direction
Pulse Sequence Parameters • SE imaging • increased TR provides nonlinear increase in SNR with linear increase in scan time • decreased TE provides nonlinear increase in SNR with no effect on scan time and less T2 weighting
Pulse Sequence Parameters • GE imaging • complex effects • maximum SNR typically between 30 and 60 degrees • long TR sequences (2D) • increase SNR with increased flip angle • short TR sequences (TOF & 3D) • decreased SNR with increased flip angle
SNR Application • pituitary imaging • baseline: • 16 cm FOV, 3 mm slice thickness, 192 phase encodes, 4 NEX • new goal: • reduced scan time, same SNR
Fat Suppression and SNR • non fat-suppressed image • each image pixel comprised of signal from water and fat in the imaging voxel • fat-suppression • reduces total signal by suppression of fat from the voxel • reduces SNR
without fat suppresion high SNR with fat suppression lower SNR SI SI frequency frequency Fat Suppression water plus fat water only