Download

1 / 48
490 likes | 645 Views
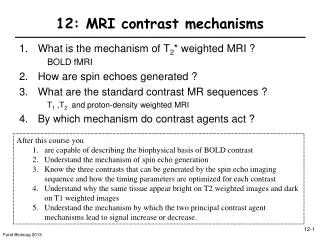
Contrast Mechanisms. An Introduction to MRI Physics and Analysis Michael Jay Schillaci, PhD Monday, February 18 th , 2008. Contrast Mechanisms. Static Contrasts Sensitive to type, number and relaxation of spins E.g., T1, T2 Motion Contrasts Sensitive to movement of spins in space

E N D
Contrast Mechanisms An Introduction to MRI Physics and Analysis Michael Jay Schillaci, PhD Monday, February 18th, 2008
Contrast Mechanisms • Static Contrasts • Sensitive to type, number and relaxation of spins • E.g., T1, T2 • Motion Contrasts • Sensitive to movement of spins in space • E.g., Dephasing, Diffusion, Perfusion • Endogenous Contrast • Depends upon intrinsic properties of tissue • E.g., BOLD fMRI • Exogenous Contrast • Uses injection of to track changes • E.g., Nuclear Medicine (NMR)
The Concept of Contrast Contrast = difference in signals emitted by water protons between different tissues For example, gray-white contrast is possible because T1 is different between these two types of tissue
MR Signal MR Signal T2 Decay transverse T1 Recovery longitudinal Static Contrast Imaging Methods time time 1 s 50 ms
Most Common Static Contrasts • Weighted by the Proton Density • Weighted by the Transverse Relaxation Times (T2 and T2*) • Weighted by the Longitudinal Relaxation Time (T1)
The Effect of TR and TE on Proton Density Contrast TE TR MR Signal MR Signal T1 Recovery T2 Decay t (s) t (ms)
Inversion Recovery to Boost T1 Contrast S = So * (1 – 2 e –t/T1) So S = So * (1 – 2 e –t/T1’) -So
T1 and T2 Values • Equilibrium magnetization • Depends on field • Depends on H20 content 1Table Adapted from: http://members.lycos.nl/mri/Nieuw/T1eng.htm 2White/Grey Matter: http://www.fmrib.ox.ac.uk/~stuart/lectures/lecture4/sld004.htm 3CSF Value: http://www.ivis.org/special_books/Braund/tipold/chapter_frm.asp?LA=1 4Values From: Huettel Chapter 5 and http://members.lycos.nl/mri/Nieuw/T1eng.htm
Image Formation - General • Integrate magnetization to get MRI signal • Select Z “slice” and form image of XY plane variations • Contrast comes from difference in magnetization values • Measurement at different times gives different contrast MRI Picture Adapted from: http://www.mri.tju.edu/phys-web/1-T1_05_files/frame.htm
Static Contrast – T1 and T2 T1 Contrast Weighting TR TE • T1 Contrast • Echo at T2 min • Repeat at T1 max • T2 Contrast • Echo at T2 max • Repeat at T1 min • Magnetization is given by Max T1 Contrast Min T2 Contrast T2 Contrast Weighting TR TE Min T1 Contrast Max T2 Contrast
Static Contrast Images • Examples from the Siemens 3T • T1 and T2 Weighted Images T1 Weighted Image (T1WI) (Gray Matter – White Matter) T2 Weighted Image (T2WI) (Gray Matter – CSF Contrast)
Flip Angle • RF Pulse Determines Flip Angle • Duration and magnitude are important • Rotation determines amount of magnetization measured +z M B0 q MZ q +y MXY BC +x Adapted from: http://www.mri.tju.edu/phys-web/1-T1_05_files/frame.htm
Field Strength • Increased field strength • Net magnetization in material is greater • Increased contrast means signal is increased • Image1 resolution is better Muscle Tissue 1MRI adapted from: http://www.mri.tju.edu/phys-web/1-T1_05_files/frame.htm
Static Contrast - T2* Relaxation • T2* accounts for magnetic defects and effects • T2 is relaxation due to spin-spin interaction of nuclei • T2M is relaxation induced by inhomogeneities of main magnet • T2MS is relaxation induced by magnetic susceptibility of material
Motion Contrast - Dephasing • Dephasing of H2O and Fat • MRI signal is a composite of Fat and H2O signals • H2O and Fat resonate at different frequencies • T1F = 210 ms, T1W = 2000 ms ( b/c T1F > T1W→ fat is brighter … ) • Relative phase gives TE dependence MF ΦFW MW Parallel ( ΦFW = 0o ) @ TE = 13.42 ms Anti-Parallel (ΦFW = 180o ) @ TE = 15.66 ms
Motion Contrast Imaging Methods Prepare magnetization to make signal sensitive to different motion properties • Flow weighting (bulk movement of blood) • Diffusion weighting (water - random motion) • Perfusion weighting (blood flow into capillaries)
Flow Weighting: MR Angiogram • Time-of-Flight Contrast • Phase Contrast
Acquisition Excitation Saturation No Flow Medium Flow High Flow No Signal Medium Signal High Signal Vessel Vessel Vessel Time-of-Flight Contrast
Time to allow fresh flow enter the slice 90o 90o RF Excitation Gx Saturation Image Acquisition Gy Gz Pulse Sequence: Time-of-Flight Contrast
Blood Flow v Externally Applied Spatial Gradient -G Externally Applied Spatial Gradient G T 2T 0 Time Phase Contrast (Velocity Encoding)
Pulse Sequence: Phase Contrast 90o RF Excitation G Gx Phase Image Acquisition -G Gy Gz
Diffusion Weighting Externally Applied Spatial Gradient -G Externally Applied Spatial Gradient G T 2T 0 Time
Excitation 90o RF G -G Gx Image Acquisition Gy Gz Pulse Sequence: Gradient-Echo Diffusion Weighting Large Lobes
Pulse Sequence: Spin-Echo Diffusion Weighting 180o 90o RF G G Excitation Gx Image Acquisition Gy Gz
Determination of fMRI Using the Directionality of Diffusion Tensor
Advantages of DWI • The absolute magnitude of the diffusion • coefficient (ADC) can help determine proton pools • with different mobility • 2. The diffusion direction can indicate fiber tracks ADC Anisotropy
D A B C DTI and fMRI
Perfusion The injection of fluid into a blood vessel in order to reach an organ or tissue, usually to supply nutrients and oxygen. In practice, we often mean capillary perfusion as most delivery/exchanges happen in the capillary beds.
Perfusion Weighting: Arterial Spin Labeling (ASL) Imaging Plane Labeling Coil Transmission
Arterial Spin Labeling Can Also Be Achieved Without Additional Coils Pulsed Labeling Imaging Plane Alternating Inversion Alternating Inversion EPISTAR EPI Signal Targeting with Alternating Radiofrequency FAIR Flow-sensitive Alternating IR
180o 180o 90o RF Gx Image Gy Alternating Proximal Inversion Odd Scan Even Scan Gz 90o 180o 180o RF Gx Image Gy Odd Scan Alternating opposite Distal Inversion Gz Even Scan Pulse Sequence: Perfusion Imaging EPISTAR FAIR
Advantages of ASL Perfusion Imaging • It is non-invasive • Combined with proper diffusion weighting • to eliminate flow signal first, it can be used • to assess capillary perfusion
Perfusion Map Perfusion Diffusion
Summary of Time Characteristics • Spin-Lattice Relaxation (T1) • nuclei realign with the magnetic field • Spin-Spin Relaxation (T2) • nuclei quickly become incoherent • Magnetic Effects and Defects (T2*) • gradients increase/decrease coherence • Echo Time (TE) • when DAQ occurs • Repeat Time (TR) • time between RF pulses Image adapted from: http://www.med.nagasaki-u.ac.jp/radiolgy/MRI%20of%20the%20FOOT/MRI-CDNUH/Fig9.html
Hemoglobin and Magnetism • The Hemoglobin (Hb) Molecule • An organic molecule containing four heme groups (with iron in each) and globular protein (globin). • Oxygen Characteristics • Oxygen bound - oxyhemoglobin (Hb) • No oxygen bound - deoxyhemoglobin (dHb) • Magnetic Properties • Hb is diamagnetic - no dipole • dHb is paramagnetic - slight dipole
Oxygen and Field Strength • Apply magnetic field to brain • Blood oxygen level differs • dHb is paramagnetic • field increased • Hb diamagnetic • Field decreased
Endogenous Contrast - fMRI • Depends on internal biological compound • Blood deoxygenation affects T2 Recovery T2 Decreasing Relaxation Time T1 Increasing Blood Oxygenation Level
BOLD - Endogenous Contrast • Blood Oxygenation Level Dependent Contrast • dHb is paramagnetic, Hb is less • Susceptibility of blood increases linearly with oxygenation • BOLD subject to T2* criteria • Oxygen is extracted from capillaries • Arteries are fully oxygenated • Venous blood has increased proportion of dHb • Difference between Hb and dHb states is greater for veins • Therefore BOLD is result of venous blood changes
MR Signal T1 Recovery BOLD - T2* Contrast MR Signal T2 Decay 50 ms 1 s