Download
1 / 25
250 likes | 370 Views
This study delves into the spectral-energy correlations of Gamma-Ray Bursts (GRBs), aiming to clarify the relationship between E_peak and E_iso, along with their implications for cosmology and astrophysics. Key questions include the impact of selection effects and the evolution of these correlations with redshift. By exploring a sample of GRBs, this work seeks to standardize energetics in GRBs and enhance understanding of their physical nature. The results challenge assumptions about these correlations, emphasizing the need for deeper analysis.

E N D
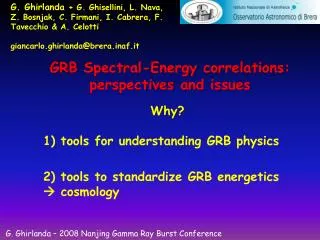
G. Ghirlanda + G. Ghisellini, L. Nava, Z. Bosnjak, C. Firmani, I. Cabrera, F. Tavecchio & A. Celotti giancarlo.ghirlanda@brera.inaf.it GRB Spectral-Energycorrelations: perspectives and issues Why? 1) toolsforunderstanding GRB physics 2) toolstostandardize GRB energetics cosmology G. Ghirlanda – 2008 Nanjing Gamma Ray BurstConference
Epeak Eiso0.57 Epeak Eg1.05 Liso Ep1.62 T45-0.49 2red=7.2 (60 dof) s=0.2 Q. Spectral-energycorrelations: truephysics or selectioneffects? 2red=0.89 (23 dof) s=0.08 2red=0.7 (16 dof) s=0.06 Amati et al. 2002 Ghirlanda et al. 2004 Firmani et al. 2005 Physicalinterpretation (e.g. Rees & Meszaros 2006, Thomson, Meszaros & Rees 2006) Studyselectioneffects Liso t - 1.05 Liso V3.0 2red=9.6 (34 dof) 2red=100 (46 dof) Liso0.57 Epeak1.85 (I) GRBswith z (II) + GRBswithout z (IV) Thermalcomponent? Reichart et al. 2000 Ramirez-Ruiz & Fenimore 2000 Yonetokuet al. 2004 Norris et al. 2000 (III) Stillnotconvinced ? (V) news
Epeak – Eiso Amati et al. 2002, 2006, Navaet al. 2006, Ghirlanda et al. 2008 … etc 76 GRBswith z and Epeak 35 before Nov. 2004 41 since Nov. 2004 9 SAX (GRBM+WFC) 5 CGRO (Batse) 15 Hete-II(Fr.+WXC) 20 Konuset al. 27(/41) Swift (BAT)
Evolutionwithredshift? NO Slopeof the 76 GRBs
REST FRAME GRBswith F>Flim Ep [Emin, Emax] Instrumental selectioneffcts OBSERVER FRAME obs frame Ep-fluencecorrelation : (Lloyd, Petrosian & Mallozzi 2000; Lambet al. 2005; Sakamotoet al. 2005) No segregation in z in the obs. frame
obs Obs Frame Epeak - F low fluence – intemediate/high Epeak Selectioneffects High fluence – intemediate/low Epeak
Trigger threshold: whichfluxto trigger? Spectralthreshold: whichfluencetomeasureEpeak? (Band 2003, 2006) Assume GRB spectrum Background Detector response a=1 b=2.3 EpeakFbol • the error on Epeak(fit) < 100% in 97.7% ofcases • Fitwith single powerlawisexcluded at 2σ
Trigger threshold: whichfluxto trigger? Spectralthreshold: whichfluencetomeasureEpeak? (Band 2003, 2006) Ghirlanda et al. 2008 BATSE couldnotdetectthisburst BATSE coulddetectedthisburst BATSE certainlydetectedthisburst and measuredEpeak
CONCLUSIONS (I) 76 GRBs (updatedtoOct. 2007) with z and spectrum 1) No evolutionof the Epeak-Eisocorrelationwithredshift. 2) A correlationisfound in the observer frame 3.1) no z segregation 3.2) Instrumentalselectioneffect: a) trigger threshold notbiasing b) spectralanalysisthreshold yes on Swift no on Batse/Sax
HOW ispopulated the Ep-Fluenceplane? Q: are there intermediate/low fluencebursts (i.e. betweenthosewith z and the spectralanalisyscurves)??
HOW ispopulated the Ep-Fluenceplane? AddGRBswithoutredshift From the literature Sakamotoet al. 2005 Butleret al. 2007 (freq) Kanekoet al. 2005 GCNs (Golenetskiet al. …) Navaet al. 2008 submitted
ExtendtheBrightBatse GRB sample (Kanekoet al. 2005)tolowerfluences Build a complete spectral sample of BATSE bursts down to ~2x10⁻⁶ erg/cm2 Peakenergydistribution Ep = 160 keV Bright BATSE Fainter BATSE
Outliersof the Epeak – Eisocorrelation 6% of BATSE bursts are outliers Navaet al. 2008 submitted
The Ep-Liso “Yonetoku” correlation The Ep-Eiso “Amati” correlation Isotropicluminosity Isotropicenergy
The Ep-Fluxplane and the outliersof the Ep-Lisocorrelation Navaet al. 2008 submitted
CONCLUSIONS (II) Ep-Fluence or Ep-Peakflux show strong correlations Addburstswithoutredshifts (+ a complete BATSE sample) Strong Ep-Fluencecorrelation Strong Ep-Peakfluxcorrelation The 20?? Ep-Eisocorrelationwillhave a differentslope & largerscatterbutmaybenotfor the Ep-Lisocorrelation 6% ofoutliersof the Ep-Eiso 0.3% ofoutliersof the Ep-Liso
Stillnotconvinced ? Are the spectral-energycorrelationsrevealing a physicalprocess or simply due toselectioneffects? Liang, Dai & Wu 2004 notedthatanEp-Lisocorrelationholds WITHIN single bursts!
Stillnotconvinced ? Are the spectral-energycorrelationsrevealing a physicalprocess or simply due toselectioneffects? Wehavestudied the timeresolvedspectraof BATSE GRBswithmeasuredredshifts
Ep-LisoisequivalenttoEp(t)-Liso(t) Ep-Lisocorrelationfoundwithtimeintegratedspectraholdsalsowithin a burst!! Ep-Liso “Yonetoku” Physicaloriginforthis ! Bosnjaket al. 2008 (tobesubm.)
(4) Interpretation – Thermal BB Interpretation of the <Epeak>Eg,iso0.5 “Geometrical” models: Eichler & lenvinson 2005a,b; Toma et al. 2005 “Radiative” models: Rees & Meszaros 2005; Tompson 2006; Thompson, Meszaros & Rees 2006 If the spectrumofGRBsisdominatedby a thermalbalck body componentthen the luminosityisnaturally LINKED to the peakenergy. EvidenceofBlack Body in GRBs: Ghirlanda, Celotti, Ghisellini 2003 980326, 970111, 911118, 910807, 910927 [Spectrumisthermalblack body in the initalphase (~2 sec), later a non-thermalcomponentdominates.] Bosnjak, Celotti, Ghirlanda 2005 990413 Ryde 2005, 2006 FitwithBlack body + Powerlaw
Thermalcomponents in GRB spectra Black Body + powerlawfits Band modelfits
Thermalinterpretationof the Amati relation Timeintegratedspectrum = sum oftimeresolved Timeresolvedspectra (BB+PL) 5 GRBsdetectedby BATSE and withWFC data the BB+PLfitto the BATSE data isinconsistentwith the X-ray (WFC) data. A single Band modelis the best fit. Ghirlanda et al. 2007
Last slide … more News: the Ep-Egcorrlation Preswift-erabursts Swift era bursts (up to March 2007) Swift era burstsof the last year Jet Breaksfrom the Optical Ghirlanda et al. 2007