Exploring Ancient Climate Through Tree Rings and Ice Core Isotopes
This document delves into advanced methods of dating geological materials and understanding past climates. Topics include the use of tree rings and ice core oxygen isotopes, which reveal seasonal variations and annual climate changes. The half-life of Carbon-14, Potassium-Argon, and Rubidium-Strontium dating methods are discussed along with their applications for dating ancient objects. Additionally, isotopic compositions help in reconstructing atmospheric conditions over hundreds of thousands of years, providing critical insights into historical climate change.


Exploring Ancient Climate Through Tree Rings and Ice Core Isotopes
E N D
Presentation Transcript
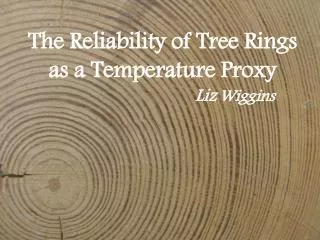
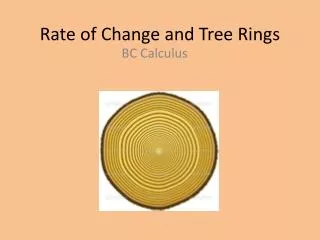
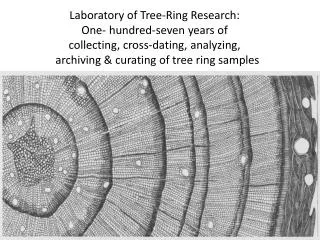
Tree Rings http://sonic.net/bristlecone/dendro.html
Carbon-14 • Half-life: 5730 years • Abundance: 1ppt • Reaction: • Supply? • Limit at about 60,000 years
Potassium-Argon dating • 40K has natural abundance of 0.0117% and a lifetime of 1.26×10⁹ years • Decay is to 40Ca or to 40Ar, with the latter more useful for dating purposes. • Gas is trapped into the crystal lattice of a rock • Rock is melted and mass spectrometer detects the amount of 40Ar • Good for objects >100,000 years old
Rubidium-Strontium dating • 87Rb has 27.8% natural abundance • Undergoes b-decay to 87Sr, t1/2 = 4.9×10¹⁰ years • [87Sr]t = [87Rb]0 - [87Rb]t = [87Rb]0(1 – e-lt) = [87Rb]t(elt - 1) • 87Sr has 7.0% natural abundance; 86Sr has 9.9% natural abundance • Precision of~1-2% for rocks 3 billion years old
Deuterium • Natural abundance – 0.0156%
Deuterium dD/Temp - 9‰/°C Measurement accuracy is better than 1‰
VSMOW 2H / 1H = 155.76 ±0.1 ppm (a ratio of 1 part per approximately 6420 parts) 3H / 1H = 1.85 ±0.36 × 10⁻¹¹ ppm (a ratio of 1 part per approximately 5.41 × 10¹⁶ parts, ignored for physical properties-related work) 18O / 16O = 2005.20 ±0.43 ppm (a ratio of 1 part per approximately 498.7 parts) 17O / 16O = 379.9 ±1.6 ppm (a ratio of 1 part per approximately 2632 parts)
Into the Arctic Oxygen IsotopesIce cores reveal annual variations within glacial ice. As with trees, rings can be detected that identify seasonal variation. By comparing the ratio of oxygen with a molecular weight of 18 (O18) to oxygen with a molecular weight of 16 (O16) scientists have determined that the rings within the ice cores represent a year long span of time. A greater amount of O16 than O18 exists in the atmosphere. Because it is heavier, O18 precipitates before O16. Consequently, in the summer, there is a greater amount of O18 in the snow pack because, with warmer temperatures, more O18 precipitates out with each snow event. Scientists can identify when one year ends by looking at the depletion of O18 in a core sample. As the amount of O18 increases again, the onset of a new summer is indicated. By looking at the relative change of O16 and O18 over a long span of time (a long ice core) it is possible to also identify changes in temperature by the relative changes in the amount of O16 compared to O18.
Ice age vs. gas age • Oxygen isotopes (in water/ice sample) give age signal • CO2 amounts in trapped air bubbles • Migration of gas, ice compression • firn n. Granular, partially consolidated snow that has passed through one summer melt season but is not yet glacial ice.
N. Caillon et al., Science 299, 1728 -1731 (2003) Figure 1. (A) Vostok records covering Termination III with respect to depth. The deuterium measured in ice combines 1-m-resolution published data (1) (black curve) and a new set of detailed measurements (every 10 cm corresponding to a time resolution of ~20 years) performed between 2680 and 2800 m (gray curve). The d40Ar of gas trapped in air bubbles is shown (triangles) (duplicate measurements were carried out with a pooled standard deviation of 0.01 ‰). (B) Vostok records with respect to the GT4 time scale: temperature deduced from the deuterium record, the accumulation (1), the d40Ar profile, and the firn depth estimated using a firn densification model (20), whose result depends both on temperature and accumulation rate, with deeper firn depth for higher accumulation and colder temperatures. Temperature, accumulation, and d40Ar are very well correlated (R2 = 0.85), which suggests that d40Ar may be used as a temperature proxy in the gas phase. The model firn depth and d40Ar data vary in antiphase during the warming.
Fig. 4. Vostok records of d40Ar and CO2 with respect to gas age (1). Atmospheric CO2 concentration is a combination of new data and published data (1, 44). The age scale for the CO2 proxy has been shifted by a constant 800 years to obtain the best correlation of the two datasets.
Greenland Abrupt Climate Change at the End of the Last Glacial Period Inferred from Trapped Air in Polar Ice Jeffrey P. Severinghaus and Edward J. Brook Science 29 October 1999:Vol. 286. no. 5441, pp. 930 - 934DOI: 10.1126/science.286.5441.930 Fig. 2. GISP2 accumulation (51), oxygen isotopes (5), methane, and nitrogen isotopes of air in bubbles during the last deglaciation, with Taylor Dome (Antarctica) methane shown for comparison (21). Low-resolution nitrogen data are from (54).
The 400-year window encompassing the Bølling Transition, showing high-resolution measurements of oxygen isotopes of ice (5) and nitrogen, argon, and methane measurements made on trapped air bubbles.