Download
1 / 14
140 likes | 304 Views
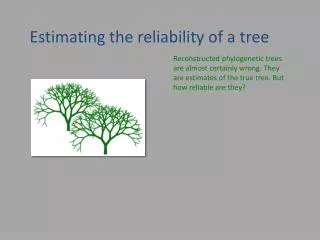
The Reliability of Tree Rings as a Temperature Proxy. Liz Wiggins. The Problem. Warming trend since the industrial revolution Is it anomalous and/or anthropogenic? Climate “Hockey Stick” (Mann et al 1998) Large percentage of data from tree rings. Data.

E N D
The Reliability of Tree Rings as a Temperature Proxy LizWiggins
The Problem • Warming trend since the industrial revolution • Is it anomalous and/or anthropogenic? • Climate “Hockey Stick” (Mann et al 1998) • Large percentage of data from tree rings
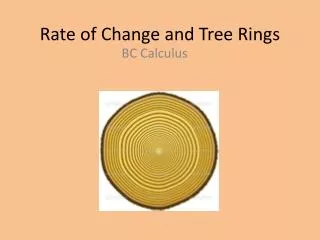
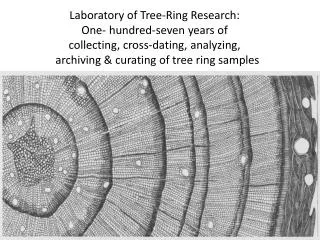
Data • 15 Northern Hemisphere tree ring records • Previously analyzed to extract temperature anomaly from tree ring width and density
Testing the Reliability • Determine the correlation between all 15 data sets • Average all 15 data sets by year and analyze warming trend • Compare historical (measured) warming trend to tree ring warming trend
Analysis • Determine the correlation between all 15 data sets • Calculate correlation coefficients • Resample using Bootstrap and recalculate correlation coefficients
Analysis • Average all 15 data sets by year and analyze warming trend • Perform least squares regression • Calculate slope and intercept • Resample using bootstrap • Perform least squares regression and calculate new slope and intercept
Analysis • Compare historical (measured) warming trend to tree ring warming trend • Calculate correlation coefficient • Least squares regression (1880-present) • Calculate slope and intercept
Results • Correlation Coefficient = 0.5651 • R2 > 0.5 The two data sets are highly correlated
Results Cont. • Historical temperature least squares regression (1880 – present) • Slope: 0.0057 • Intercept: -11.1633 • Tree ring temperature least squares regression (1880 – present) • Slope: 0.0056 • Intercept: -10.7432 • Same slope = Same trend
Conclusions • Tree ring records are not highly correlated with each other (R2 = 0.1224 < 0.3) • Average of all tree ring temperature anomalies is highly correlated (R2 = 0.5651 > 0.5) to historical temperature anomalies • As long as multiple tree ring records are used, they can be considered a reliable proxy • Tree ring data used in “Hockey Stick” confirmed
References • Mann, Michael E., Raymond S. Bradley, and Malcom K. Hughes. Northern Hemisphere Temperatures during the past Millennium: Inferences, Uncertainties, and Limitations. Geophysical Research Letters 26.6 (1999): 759-62. • Wilson, Rob M., et al, A Matter of Divergence: Tracking Recent Warming at Hemispheric Scales Using Tree Ring Data. Journal of Geophysical Research - Atmospheres 112.D17103 (2007). • http://a-sceptical-mind.com/wp-content/uploads/2009/12/Hockey_stick_chart_ipcc_large.jpg • http://www.google.com/url?sa=i&rct=j&q=&esrc=s&source=images&cd=&docid=tYz42wFDW34WaM&tbnid=2DWa-hfxkmPGXM:&ved=0CAIQjBw&url=http%3A%2F%2F193.105.21.101%2Fimage%2F7358%2Fthe_texture_of_the_tree_rings_1920x1200.jpg&ei=wKZ2UZWTNIP-8ASAi4CoBw&bvm=bv.45512109,d.eWU&psig=AFQjCNEFs46ebQTZYe4ZCS-q7NzV54S-mg&ust=1366816818675207 • http://www.mensadventuretravel.com/wp-content/uploads/2009/02/bristlecone-pine-12.jpg