Download
1 / 1
10 likes | 166 Views
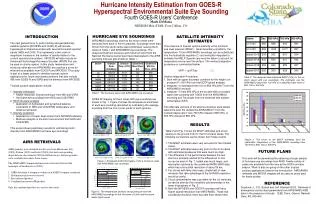
Lili 02 Oct 2002 07 UTC Lili 03 Oct 2002 08 UTC Isabel 13 Sep 2003 17 UTC. Isabel 14 Sep 2003 18 UTC Isabel 16 Sep 2003 18 UTC Isabel 17 Sep 2003 18 UTC. Figure 1. Enhanced GOES IR imagery of the 6 hurricane cases with AIRS/AMSU eye soundings.

E N D
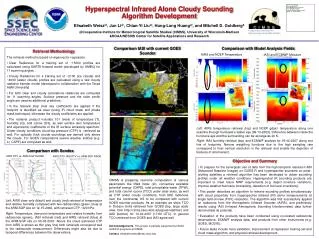
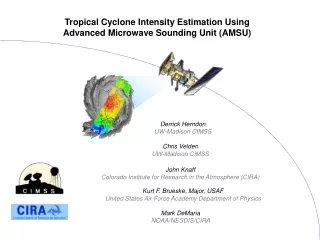
Lili 02 Oct 2002 07 UTC Lili 03 Oct 2002 08 UTC Isabel 13 Sep 2003 17 UTC Isabel 14 Sep 2003 18 UTC Isabel 16 Sep 2003 18 UTC Isabel 17 Sep 2003 18 UTC Figure 1. Enhanced GOES IR imagery of the 6 hurricane cases with AIRS/AMSU eye soundings Hurricane Intensity Estimation from GOES-R Hyperspectral Environmental Suite Eye Sounding Fourth GOES-R Users’ Conference Mark DeMaria NESDIS/ORA-STAR, Fort Collins, CO SATELLITE INTENSITY ESTIMATES HURRICANE EYE SOUNDINGS INTRODUCTION AIRS/AMSU soundings closet to the storm center were extracted from each of the 16 granules. Soundings more than 30 km from the storm center were eliminated, leaving the 6 cases in Table 1 with AIRS/AMSU eye soundings. The observed minimum pressure and maximum wind from the National Hurricane Center best track interpolated to the AIRS sounding time are also shown in Table 1. • The next generation U.S. polar orbiting and geostationary • satellite systems (NPOESS and GOES-R) will include • hyperspectral infrared sounders with several thousand spectral • bands (HES and CrIS). This represents a two order of • magnitude increase in the number of bands relative to the • current operational sounders. NPOESS will also include an • Advanced Technology Microwave Sounder (ATMS) that can • be used in cloudy regions. In this study, temperature and • moisture retrievals from AIRS/AMSU are used as a proxy for • what will be available from GOES-R and NPOESS. This study • is part of a larger project to develop tropical cyclone • applications for future instrument platforms that also include • ABI from GOES-R and VIIRS and the altimeter from NPOESS. • Tropical cyclone applications include: • Intensity estimation • Higher resolution Dvorak technique from ABI and VIIRS • Hurricane eye soundings from HES and CrIS/ATMS • 2. Wind structure analysis • Application of hydrostatic and dynamical balance constraints to HES and CrIS/ATMS temperature and moisture retrievals • 3. Intensity prediction • Applications of ocean heat content from NPOESS altimetry • Moisture analysis in the storm environment from HES and CrIS/ATMS • This poster shows preliminary results for estimating storm • intensity from AIRS/AMSU hurricane eye soundings • One measure of tropical cyclone intensity is the minimum • sea level pressure (MSLP). Given boundary conditions, the • temperature T from AIRS/AMSU soundings can be substituted • into the hydrostatic equation (1) and vertically integrated to • estimate the MSLP. Special care must be taken to account for • temperature errors near the surface. The vertical integration • procedure is summarized below. • dP/P = -g/(RT)dz (1) • Vertical Integration Procedure: • Start with an upper boundary condition for the height z at • pressure P=100 hPa from the NCEP global analysis • 2. Integrate (1) downward from 100 to 850 hPa with T from the • AIRS/AMSU retrieval • 3. Integrate (1) from 850 hPa to the surface with a constant • lapse rate sounding with T(850) from the AIRS/AMSU • sounding and T(surface) from the observed sea surface • temperature (SST) • Two alternate versions of the above procedure were tested • where the level the divides the AIRS/AMSU T from the • constant lapse rate T was 700 hPa instead of 850 hPa, or • 500 hPa instead of 850 hPa. Table 2. The observed and estimated MSLP (hPa) for the six storm cases with eye soundings. The estimates use the AIRS/AMSU input from 100 hPa to a specified lower level of 850, 700 or 500 hPa. Table 1. The hurricane cases with AIRS/AMSU eye soundings. GOES IR imagery for the 6 cases with eye soundings are shown in Fig. 1. Figure 2 shows the temperature anomalies of each eye sounding calculated by subtracting the average sounding from the four corner points of each granule. RESULTS • Table 2 and Fig. 3 show the MSLP estimates and errors • relative to the ground truth for the 6 hurricane cases. The • following conclusions can be drawn from these results. • The MSLP estimates were very accurate for the 4 Isabel • cases. • 2. The MSLP estimates were very poor for the 2 Lili cases • with estimated pressures that were much too high. • 3. The difference in the performance between the two • storms is probably related to the differences in size • as can be seen in Fig. 1. Isabel was much larger, and • was better resolved by the combined AMSU/AIRS data, • which has a horizontal resolution of about 50 km. • 4. For storms with fairly clear eyes, single field of view • retrievals that take advantage of the full AIRS resolution • would be useful. • 5. Cloud contamination was a problem for the Lili retrievals, • as can be seen by the unrealistic cold anomalies in the • lower troposphere in Fig. 2. • 6. Both the NPOESS and GOES-R sounders will have • higher spatial resolution than AIRS/AMSU. Those eye • soundings should be more accurate than shown here. Figure 3. The errors of the MSLP estimates from the hydrostatic integrations of the AIRS/AMSU sounding from 100 hPa to 850, 700 or 500 hPa. AIRS RETRIEVALS • AIRS granules were obtained for all cases from Hurricanes Lili • (2002), Fabian (2003) and Isabel (2003) that had corresponding • dropwindsone data from the NOAA Gulfstream jet. Sixteen granules • were available from these three storms. • The AIRS/AMSU temperature/moisture retrievals followed the • technique of Susskind et al (2003): • AIRS data from 9 footprints within each AMSU footprint combined • Preliminary microwave retrieval • First infrared product • Combined microwave/IR product • Only the combined product was used in this study. FUTURE PLANS This work will be generalized by obtaining a larger sample of hurricane eye soundings from AIRS. A wide variety of cases are available from the very active 2005 hurricane season. Work is also on-going on the other tropical cyclone applications listed in the Introduction. AIRS/AMSU retrievals and MODIS imagery will be used as proxy data for those studies. REFERENCE Susskind, J., C.D. Barnet and J.M. Blaisdell 2003. Retrieval of atmospheric and surface parameters from AIRS/AMSU/HSB data in the presence of clouds. IEEE Trans. Geosci. Remote Sens.41, 390-409 Figure 2. The temperature anomaly versus pressure from the AIRS/AMSU soundings for the Hurricane Lili (left) and Hurricane Isabel (right) cases