Download
1 / 14
140 likes | 288 Views
Geostationary Operational Environmental Satellite R- Series GOES-R Proving Ground. High Latitude and Arctic Test Bed Dr. Frank P Kelly Director Alaska Region NWS. Proving Ground Mission Statement.

E N D
Geostationary Operational Environmental Satellite R- SeriesGOES-RProving Ground High Latitude and Arctic Test Bed Dr. Frank P Kelly Director Alaska Region NWS
Proving Ground Mission Statement • The GOES-R Proving Ground engages NWS in pre-operational demonstrations of selected capabilities of next generation GOES • Objective is to bridge the gap between research and operations by: • Utilizing current systems (satellite, terrestrial, or model/synthetic) to emulate future GOES-R capabilities • Infusing GOES-R products and techniques into NWS operations with emphasis on AWIPS and transitioning to AWIPS-II. • Engaging in a dialogue to provide feedback to developers from users • The Proving Ground accomplishes its mission through: • Sustained interaction between developers and end users for training, product evaluation, and solicitation of user feedback. • Close coordination with GOES-R Algorithm Working Group (AWG) and Risk Reduction programs as sources of demonstration products, promoting a smooth transition to operations Intended outcomes are Day-1 readiness and maximum utilization for both the developers and users of GOES-R products, and an effective transition to operations
Key Components of Proving Ground Ability to fully test Individual components Integrated components Testing concepts Simulate Low-end events High-end non-routine events Archived events Live events Test team Independence Test experts, trainers, and operational users Ability to make recommendations based on impacts
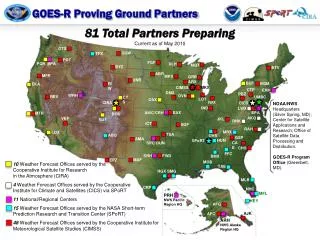
Proving Ground Participants • Proving Ground participants are broken into two categories • Providers • Providers are those organizations that develop and deliver the demonstration product(s) and training materials to the consuming organization. • Cooperative Institute for Meteorological Satellite Studies (CIMSS) • Consumers • Consumers are those who work with the providers to integrate the product(s) for demonstration into an operational setting for forecaster interaction. • Weather Forecast Office, River Forecast Center, Alaska Aviation Weather Unit (includes VAAC) • Partner agencies • National Park Service • Federal Aviation Administration • United States Geological Survey
Google Earth example Hybrid: MODIS (Terra) 250m Vis (1940Z)over GOES-West 1km Vis (1930Z) SPoRT Sea Surface Temperature
Issues to address in Proving Ground activities • to what extent will high latitude viewing of Alaska with GOES-R instrumentation affect utility of GOES-R ABI products? • how can combined GOES-R / POES products alleviate these shortcomings? • Relevant products to address forecast problems? • work with GOES-R algorithm working group (AWG) teams to acquire proxy ABI products (based on current GOES or MODIS data streams) and disseminate • Decision support system of choice – AWIPS, AWIPS II, Google Earth, other collaboration tools Aviation Volcanic ash detection and height Visibility – smoke, low cloud, fog Land Snow cover, LST Vegetation products Fire hot spots / intensity Ocean SSTs Atmospheric TPW Precipitation estimates Potential GOES-R PG Products / Issues – Alaska – Canada (Partnering with NASA SPoRT) transitioning unique NASA data and research technologies to operations
SPoRT Alaska interests BASELINEProducts OPTION 2 Products Clouds and Moisture Imagery (KPP) Clear Sky Mask Cloud Top Pressure and Height Cloud Top Phase Cloud Top Temperature Cloud Particle Size Distribution Cloud Optical Path Temperature and Moisture Profiles Total Precipitable Water Stability Parameters (Lifted Index) Aerosol Detection Aerosols Optical Depth Derived Motion Winds Hurricane Intensity Fire/Hot Spot Characterization Land and Sea Surface Temperature Volcanic Ash Rainfall Rate Snow Cover Downward Solar Insolation: Surface Reflected Solar Insolation: TOA Lightning Detection Cloud Layer/Heights Cloud Ice Water Path Cloud Liquid Water Cloud Type Convective Initiation Turbulence Low Cloud and Fog Enhanced “V”/Overshooting Top Aircraft Icing Threat SO2 Detections (Volcanoes) Visibility Upward Longwave Radiation (TOA) Downward Longwave Radiation (SFC) Upward Longwave Radiation (SFC) Total Ozone Aerosol Particle Size Surface Emissivity Surface Albedo Vegetation Index Vegetation Fraction Flood Standing Water Rainfall probability and potential Snow Depth Ice Cover Sea & Lake Ice Concentration, Age, Extent, Motion Ocean Currents, Currents: Offshore Advanced Baseline Imager (ABI) Advanced Baseline Imager (ABI) GLM GOES-R Products transitioning unique NASA data and research technologies to operations
12-hr forecast valid 0000 UTC 8 February 2010 • Contour intervals for 1000 hPa mixing ratio (filled) are 0.5 g/kg; • Interval for PMSL (black) is 4 hPa AIRS GFS-ANALYSIS High resolution SST product A Few Pertinent Examples AIRS Real-time 3D Analysis / Forecasts • SPoRT produces a high resolution (1km) SST product derived from MODIS and AMSR-E SST data • provides valuable input to weather models • combined with ice analysis, can be useful diagnostic tool throughout the year. • WRF forecast with AIRS profile information over North Pacific Ocean • AIRS forecast provides a more detailed thermodynamic structure than GFS • Mixing ratio in AIRS run closer to GFS analysis than in control run (no AIRS data) in both magnitude and pattern • Analysis alone provides improved thermodynamic structure for improved diagnostic analysis transitioning unique NASA data and research technologies to operations
Barrow Downlink Site Fairbanks Command and Data Acquisition Site
attachment GINA/CIFAR UAF
NOAA’sNational Weather ServiceAlaska Region Polar Communications and Weather Satellite Workshop Dr. Frank Kelly Director, Alaska Region