Download
1 / 24
270 likes | 556 Views
Transportation Forecasting What is it?. Transportation Forecasting is used to estimate the number of travelers or vehicles that will use a given transportation facility in the future

E N D
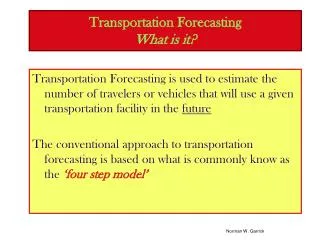
Transportation ForecastingWhat is it? Transportation Forecasting is used to estimate the number of travelers or vehicles that will use a given transportation facility in the future The conventional approach to transportation forecasting is based on what is commonly know as the ‘four step model’ Norman W. Garrick
The Four Step Model • Trip Generation Estimates the number of trips from given origins and destinations • Trip Distribution Determines the destination for each trip from a given origin • Mode Choice Determines the mode choice for each trip • Route Assignment Determines the specific route for each trip Norman W. Garrick
1 3 2 5 4 8 7 6 Trip Generation Trip Generation model is used to estimate the number of person-trips that will begin or end in a given traffic analysis zone The unit of analysis for traffic generation is the TAZ Norman W. Garrick
Estimated Target year socio-economic, land use data Predicted Target year No. of Trips Calibrated Model Relating trip making to socio-economic and land use data Trip GenerationDeveloping and Using the Model Survey Base Year Socio-economic, land use And Trip making Norman W. Garrick
Trip GenerationDeveloping and Using the Model The trip generation model typically can take the form of No. of trips = Function (pop, income, auto ownership rates) The model is developed and calibrated using BASE year data Norman W. Garrick
Trip GenerationDeveloping the Model Trip Generation models are often developed from travel surveys. These surveys are used to determine the trip making pattern for a sampling of house holds in the area. This trip making pattern is then related to land use (nominally) and socioeconomic factors that are considered to affect travel patterns Common socioeconomic factors considered include population, income, and auto ownership rates Norman W. Garrick
Trip GenerationTrip Purpose Often separate predictions are mode for different type of trips since travel behavior depends on trip purpose In other words different models must be developed for each trip type The category of trip types commonly used include • Work trips • School trips • Shopping trips • Recreational trips Norman W. Garrick
Trip GenerationExample of a Trip Generation Model One way of presenting the trip generation model developed from a survey is as a cross-classification table Norman W. Garrick
Calibrated Model Relating trip making to socio-economic and land use data Trip GenerationSurvey and Model Survey Base Year Socio-economic, land use And Trip making Norman W. Garrick
Trip GenerationCross-classification Model Norman W. Garrick
Estimated Target year socio-economic, land use data Calibrated Model Relating trip making to socio-economic and land use data Trip GenerationDeveloping and Using the Model Survey Base Year Socio-economic, land use And Trip making Norman W. Garrick
Trip GenerationBase Year Demographics Norman W. Garrick
Estimated Target year socio-economic, land use data Predicted Target year No. of Trips Calibrated Model Relating trip making to socio-economic and land use data Trip GenerationDeveloping and Using the Model Survey Base Year Socio-economic, land use And Trip making Norman W. Garrick
Trip GenerationBase Year Demographics Number of Trips = trip rate*no. of HH = 0.6 * 100 = 60 Total trip = 13,080 Norman W. Garrick
Trip GenerationPlanning for the Future and Uncertainties In an earlier lecture we talk about the uncertainties associated with making prediction for the future and the importance of not treating predictions as if they are set in stone but rather as a guide to help in decision making In considering the ‘trip generation’ process it is important to understand some potential sources of uncertainties Norman W. Garrick
Trip GenerationSources of Uncertainties in Predicting Number of Trips Significant errors can creep into the trip generation process in another of places including • The model development • The Prediction of future demographics • The use of the model for predicting the future Norman W. Garrick
Trip GenerationModeling Land Use is one Major Source of Uncertainty • The modeling of the different types of land use and their effect on travel pattern is usually relatively weak • Land use and transportation changes alter the relationship between the number of trips and the socio-economic factors.But the trip generation process typically assume that this relationship is constant over the period of the study Norman W. Garrick
Trip GenerationDemographics and Trip Making Factors affected by Land Use The land use pattern may affect • Car ownership rates • Household size and composition • Number of daily trips • Mode of trips • Length of trips Norman W. Garrick
Trip GenerationWhat is Predicted? Trip generation models predict so called TRIP ENDS for each zone The trip ends maybe classified as either • ORIGINS and DESTINATIONS (O-D) or • PRODUCTIONS and ATTRACTIONS The two sets of terms sound similar but there is a technical difference Norman W. Garrick
Origins and Destinations Residential 1 Non-residential 8 • A worker leaves Zone 1 in the morning to go to work in Zone 8 • This results in 2 trip ends: • One Origin for Zone 1 • One Destination for Zone 8 Non-residential Residential Total Number of Trip Ends Zone 1: 2 Trip Ends (1 O, 1 D) Zone 8: 2 Trip Ends (1 O, 1 D) • When that same worker leaves Zone 8 in the evening to go to home to Zone 1 • This results in another 2 trip ends: • One Destination for Zone 1 • One Origin for Zone 8 Norman W. Garrick
Productions and Attractions Residential 1 Non-residential 8 • A worker leaves Zone 1 in the morning to go to work in Zone 8 • This results in 2 trip ends: • One Production for Zone 1 • One Attraction for Zone 8 Non-residential Residential Total Number of Trip Ends Zone 1: 2 Trip Ends (2 Productions) Zone 8: 2 Trip Ends (2 Attractions) • When that same worker leaves Zone 8 in the evening to go to home to Zone 1 • This results in another 2 trip ends: • One Production for Zone 1 • One Attraction for Zone 8 Norman W. Garrick
Origins and Destinations??Productions and Attractions?? Based on the convention of trip generation models Origins and Destinations are defined in terms of the direction of the trip Productions and Attractions are defined by the land use Residential Land use PRODUCES trip ends Non-residential land use ATTRACTS trip ends This is a useful distinction because of how trip generation models are typically developed Norman W. Garrick
Modeling Productions and Attractions Residential 1 Non-residential • For example, Trip Ends for Zone 1 would be reported as • 1000 Production Trip Ends • 500 Attraction Trip Ends Trip generation models typically model separately, i) residential trip production, ii) non-residential trip attractions This approach works for home based trips (HB). But falls apart when we start to consider non-home based trips (NHB). Special techniques are developed to deal with the relatively small number of NHB that occurs. Norman W. Garrick
Trip Rate Analysis Method of Trip Generation • Trip-Rate Analysis Trip rate is estimated on characteristics of the trip generators with in the zone. Production rates are determined using the characteristics of the residential land uses and attraction rates using the characteristics of the nonresidential land uses • Example • The characteristics of the trip generator is given in 1000 SQ. FT. • And the trip generation rate for each generator is given as TRIPS PER 1000 SQ. FT. • For example • Residential: Total 1000 Sq. Ft. = 2744 1000 sq. ft., Trip Gen. Rate = 2.4 trips/1000 sq.ft • TOTAL NO. of TRIP from residential land use = 2744*2.4 = 6586 Trips This method of trip generation is often used to do site impact studies Norman W. Garrick