Download
1 / 11
110 likes | 126 Views
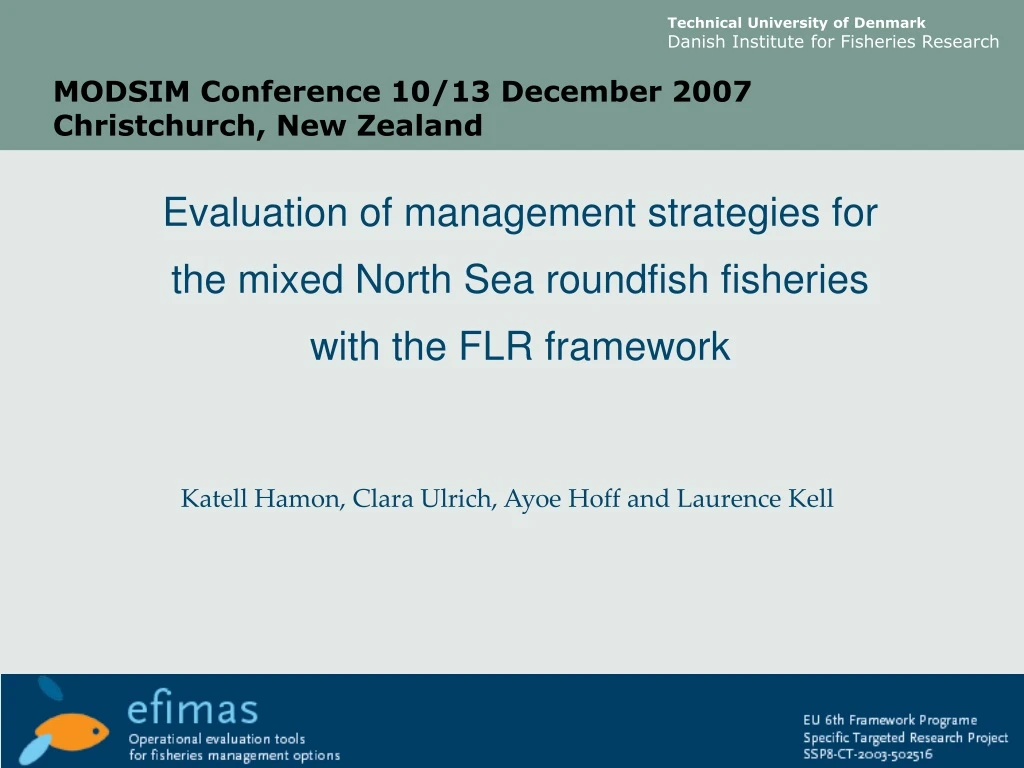
MODSIM Conference 10/13 December 2007 Christchurch, New Zealand. Evaluation of management strategies for the mixed North Sea roundfish fisheries with the FLR framework. Katell Hamon, Clara Ulrich, Ayoe Hoff and Laurence Kell. Why Use Management Strategy Evaluations?.

E N D
MODSIM Conference 10/13 December 2007Christchurch, New Zealand Evaluation of management strategies for the mixed North Sea roundfish fisheries with the FLR framework Katell Hamon, Clara Ulrich, Ayoe Hoff and Laurence Kell
Why Use Management Strategy Evaluations? • Failure of current European management • Decreasing stocks objectives not reached • Short term, single species management • Credibility crisis in European scientific community • Most European stocks managed via quotas • 2 years delay • real F ≠ target F • Not accounting for technical interactions • Complex management system ICES, STECF, European Commission, numerous uncertainties in the system • Alternative to traditional projections MSE
Operating Model = “at sea” Fleets Stocks Management procedure = “at land” ? Assessment Management ? ? ? Implementation ?
Models vs. toolbox • Up to now : development of various models more or less generic • User ≠ developer • Developed for a given approach • Interface user-friendly and/or computing speed more than code transparency • Models easily used by managers BUT in practice always run by scientists • FLR toolbox: common language rather than model • User = Developer (of his model / of tools) • Open Source. Access, transparency, control, exchange between institutes • Use of R statistical and graphical tools • Balance between user-friendliness and flexibility http://www.flr-project.org
FLR - Basics • OOP: inheritance, polymorphism and encapsulation • S4 classes • FLQuant 6 dimensional array + character string for units • dim1: age, length, life history stage, etc • dim2: year • dim3: unit (sex or other extra dimension needed) • dim4: season • dim5: area • dim6: iter • Methods and functions: dims, summary, show, plot, xyplot, bwplot, dotplot, barchart, stripplot, histogram, bubbles, [], as.data.frame, apply, window, trim, propagate, dim[Sums, Means, Vars]
FLR – Complex objects namedescrangecatch catch.n catch.wtdiscards discards.n discards.wt landings landings.nlandings.wtstock stock.nstock.wtm mat harvestharvest.spwnm.spwn • FLStock • exploited stock data (biology and catch) • FLFleet • fleet data at different level (metier, stock) • FLIndex • abundance index data
FLR Lego blocks OPERATING MODEL Represents the “true” dynamics of the system against which performance will be measured MANAGEMENT PROCEDURE Assess status of stock and set management options depending upon perceived status of fishery stock(s) MODEL CONDITIONING Management decision stage Fleet dynamics FLFleet Management procedure FLHCR Biological reference points (e.g. MSY) FLBRP IMPLEMENTATION MODEL FLEcon INITIAL CONDITIONS SUMMARY STATISTICS Used to evaluate performance of management procedures against objectives. Population biology Assessment procedure Stock dynamics FLBiol OBSERVATION ERROR MODEL Generation of data on fishery and stocks. FLOEM Perceived stock FLStock Stock assessment (e.g. VPA) FLAssess Stock processes e.g. Recruitment FLSR Auxiliary information (e.g. tuning indices) FLIndices Assessment assumptions Kell et al, 2007
Case study North Sea Roundfish - Presentation • Mix-fisheries, multispecies: 2 species, cod and haddock • 11 fleets (5 pays) + 1 fleet (NN) / 49 metiers • Operating Model: • Estimation of recruitment by Stock-Recruitment model • Effort of the fleets estimated effort needed to catch to max or min quota • Model of entry/exit of vessels in the fishery driven by economics • Management Procedure: • Stock assessment based on XSA (Darby and Flatman, 1994) • Harvest Control Rules (HCR): based on EU-Norway agreements • Accounting for uncertainty • Measurement error : tuning fleet CPUE • Process error : recruitment • Estimation error : use of XSA to estimate N and F • Implementation error: • EU-Norway HCR • Stop fishing at first/last quota reached Basé sur les définitions de Rosenberg et Restrepo, 1994
Case study North Sea Roundfish - Results Real stock in black; Perceived stock in green; Reference points in red stop at 1st quota reached fish until the last quota
Pros vs Cons • Open source: never stable, dependant on R • steep learning curve • slowness of R /FLR • Not a model!! development of 1 MSE takes time • User = Developer • Open Source: free access, transparency, exchange • Toolbox: Adaptability, flexibility, diversity • Largely used in Europe: ICES WG, European projects, STECF • Interactivity with stakeholders: hypothesis / outputs • User = Developer
More about FLR : Wiki: http://flr-project.org/doku.php Paper: Kell, L. T., Mosqueira, I., Grosjean, P., Fromentin, J-M., Garcia, D., Hillary, R., Jardim, E., Mardle, S., Pastoors, M. A., Poos, J. J., Scott, F., and Scott, R. D. 2007. FLR: an open-source framework for the evaluation and development of management strategies. – ICES Journal of Marine Science, 64: 640–646. More about EFIMAS http://www.efimas.org/ THANK YOU