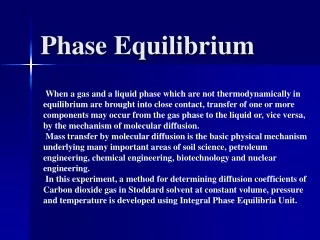
Phase Equilibrium
Phase Equilibrium. Chapter 11, Section 4. Some Review. What is a system? The components that are being studied What are the states of matter? What is a phase? A region that has the same composition and properties throughout

Phase Equilibrium
E N D
Presentation Transcript
Phase Equilibrium Chapter 11, Section 4
Some Review • What is a system? • The components that are being studied • What are the states of matter? • What is a phase? • A region that has the same composition and properties throughout • Think about a glass of ice water…..how many phases are present in the glass?
Units of Pressure • Atmosphere • kPa • mmHg 1 atm = 101.3 kPa = 760 mmHg
Some terms • Equilibrium – the state in which a process and the reverse process occur at the same rate • Phases – involves changes of state • Chemical reactions – involves equal amounts of products and reactants being formed at the same time • Vapor pressure – the partial pressure exerted by a vapor that is in equilibrium with its liquid state
More Terms • Boiling point • The temperature at which the vapor pressure equals the external pressure • As the temperature of the water increases, molecules have more kinetic energy, so more enter the gas phase. This causes an increase in vapor pressure. • Melting point • The temperature at which a solid and liquid are in equilibrium • Not affected by changes in pressure
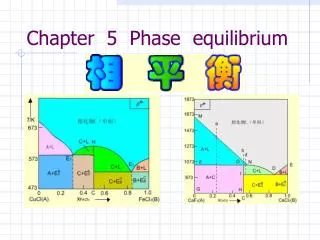
Phase Diagrams • A graph of the relationship between the physical state of a substance and the temperature and pressure of the substance • Contains 3 lines: • Vapor pressure curve – liquid/gas equilibrium • Changes of state? • Liquid/solid equilibrium • Changes of state? • Solid/gas equilibrium • Changes of state?
More Phase Diagrams • Terms – • Triple point – the point where all three lines meet • Critical point – the temperature and pressure at which the gas and liquid states of a substance become identical and form one phase (called a supercritical fluid) • Phase diagrams are unique to each pure substance and can be used to help identify an unknown substance
Phase Diagram of CO2 • Triple point = -56.7ºC, 518 kPa • Critical point = 31.1ºC, 7.38 x 10³kPa • Vapor pressure of the solid at 1 atm = -78.5ºC • Label • X-axis – Temperature • Y-axis – Pressure
Draw the Diagram • Vapor pressure curve of the solid goes from the triple point through -78.5ºC and 1 atm (101.3 kPa). • Line for equilibrium between solid and liquid begins at the triple point, goes upward almost vertically, and has a slightly positive slope • See graph on p. 403 to compare your graph.
Things to note about CO2 • The horizontal line at 1 atm does not intersect the solid-liquid line • Think about dry ice…..Carbon dioxide is never a liquid at standard pressure • Solid carbon dioxide sublimes at -78.5ºC
More Practice • Page 404 – Practice problems