Download
1 / 15
150 likes | 173 Views
The HyspIRI mission aims to provide integrated global terrestrial and aquatic studies to understand ecosystem function, composition, and structure. It will monitor habitat distribution, biodiversity, and ecological changes using an imaging spectrometer in the visible to shortwave infrared (VSWIR) and a multispectral imager in the thermal infrared (TIR).

E N D
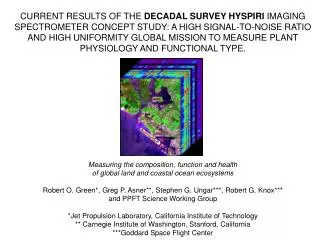
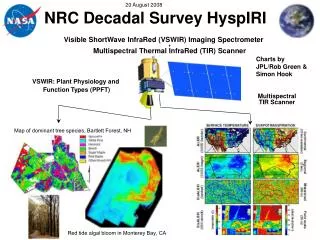
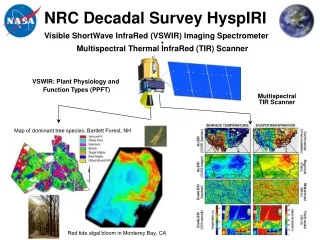
NRC Decadal Survey HyspIRI Visible ShortWave InfraRed (VSWIR) Imaging Spectrometer+ Multispectral Thermal InfraRed (TIR) Scanner VSWIR: Plant Physiology and Function Types (PPFT) Multispectral TIR Scanner Map of dominant tree species, Bartlett Forest, NH Red tide algal bloom in Monterey Bay, CA
HyspIRI Decadal Survey Mission In its Decadal Survey Earth Science and Applications from Space: National Imperatives for the Next Decade and Beyond, the National Research Council of the National Academies recommended: - A mission for integrated global terrestrial and aquatic studies, - Management of terrestrial and coastal natural resources, - Forecasting ecological changes and natural hazards. HyspIRI: - now in conceptual design phase at NASA - Imaging spectrometer in the visible to shortwave infrared (VSWIR) and a multispectral imager in the thermal infrared (TIR)
HyspIRI Mission Overview Urgency and Focus Fundamental topics to understand about ecosystems: * function, composition, and structure --> Habitat distribution and biodiversity 2007 - two mission concept studies where completed: * Plant physiology and functional type (PPFT): VSWIR spectrometer * Surface temperature, emissivity, atmospheric science: (TIR) A 2009 Instrument and Mission update and refinement activity is underway.
HyspIRI Science Study Group Mike Abrams JPL michael.j.abrams@jpl.nasa.gov 818-354-0937 Rick Allen UID rallen@kimberly.uidaho.edu 208-423-6601 Martha Anderson USDA Martha.Anderson@ars.usda.gov 301-504-6616 Greg Asner Stanford gpa@stanford.edu 650-462-1047 Bryan Bailey USGS EROS gbbailey@usgs.gov 605-594-6001 Paul Bissett FERI pbissett@flenvironmental.org 813-866-3374 x102 Alex Chekalyuk Lamont-Doherty chekaluk@ldeo.columbia.edu 845-365-8552 James Crowley USGS jcrowley@usgs.gov 703-648-6356 Ivan Csiszar UMD icsiszar@hermes.geog.umd.edu 301-405-8696 Heidi Dierssen U Conn. heidi.dierssen@uconn.edu Friedmann Freund Ames friedemann.t.freund@nasa.gov John Gamon U A gamon@gmail.com Louis Giglio UMD louis_giglio@ssaihq.com 301 867-2030 Greg Glass JHU gglass@jhsph.edu 410-955-3708 Robert Green JPL rog@jpl.nasa.gov Simon Hook JPL simon.j.hook@jpl.nasa.gov 818-354-0974 James Irons GSFC James.R.Irons@nasa.gov 301-614-6657 Bob Knox GSFC Robert.G.Knox@nasa.gov 301-614-6656 John Mars USGS jmars@usgs.gov 703-648-6302 Betsy Middleton GSFC elizabeth.m.middleton@nasa.gov 301-614-6670 Peter Minnett U. Miami pminnett@rsmas.miami.edu 305-361-4104 Frank Muller Karger U. MA Dartmouth fmullerkarger@umassd.edu 508 999 8193 Scott Ollinger UNH scott.ollinger@unh.edu Anupma Prakash UAF prakash@gi.alaska.edu 907-474-1897 Dale Quattrochi MSFC dale.quattrochi@nasa.gov 256-961-7887 Vince Realmuto JPL Vincent.J.Realmuto@jpl.nasa.gov 818-354-1824 Dar Roberts UCSB dar@geog.ucsb.edu Dave Siegel UCSB davey@icess.ucsb.edu 805-893-4547 Phil Townsend U of Wisconsin ptownsend@wisc.edu 608-262-1669 Kevin Turpie GSFC kevin.r.turpie@nasa.gov 301-286-9996 Steve Ungar GSFC stephen.g.ungar@nasa.gov Susan Ustin UC Davis susan@cstars.ucdavis.edu Rob Wright UHI wright@higp.hawaii.edu 808-956 9194
HyspIRI VSWIR Science Questions: Apply to both aquatic and terrestrial systems and their interactions
HyspIRI VIS/SWIR Imaging Spectroscopy Science Measurements Science Questions: • What is the composition, function, and health of land and water ecosystems? • How are these ecosystems being altered by human activities and natural causes? • How do these changes affect fundamental ecosystem processes upon which life on Earth depends? Imaging spectrometer: 87kg / 38W Schedule: 4 year phase A-D, 3 years operations All components have flown in space Map of dominant tree species, Bartlett Forest, NH Measurement: • 380 to 2500 nm in 10nm bands • Accurate 60 m resolution • 150 km swath • 19 d revisit VSWIR • Global land and shallow water; global oceans at 1 km Aquatic Terrestrial Red tide algal bloom in Monterey Bay, CA
HyspIRI Thermal Infrared Science Measurements • Measure the land surface temperature and emissivity • 5 day equatorial revisit to generate monthly, seasonal and annual products. • 60 m spatial resolution • 7 bands between 7.5-12 µm and 1 band between 3-5 µm • 3-5 µm band saturates at 1400K • 7.5-12 µm bands saturate at 400K 1000 m TIR at 60 m
HyspIRI VSWIR Science Measurements Characteristics Temporal Orbit Crossing 11 am sun synchronous descending Global Land Coast Repeat 19 days at equator Rapid Response Revisit 3 days (cross-track pointing) Sunglint Avoidance Cross Track Pointing 4 degrees in backscatter direction OnOrbit Calibration Lunar View 1 per month {radiometric} Solar Cover Views 1 per week {radiometric} Surface Cal Experiments 3 per year {spectral & radiometric} Data Collection Land Coverage Land surface above sea level Water Coverage Coastal zone -50 m and shallower Solar Elevation 20 degrees or greater Open Ocean Averaged to 1km spatial sampling Compression >=3.0 lossless
HyspIRI VSWIR Science MeasurementsKey SNR and Uniformity Requirements Required SNR Benchmark Radiances Uniformity Requirement Cross Track Sample Depiction -Grids are the detectors -dots are the IFOV centers -Colors are the wavelengths Requirement Spectral Cross-Track >95% cross-track uniformity {<0.5 nm min-max over swath} Spectral-IFOV-Variation >95% spectral IFOV uniformity {<5% variation over spectral range} Wavelength
Summary - HyspIRI • Mission provides measurement to answer the Plant Physiology and Functional types/PPFT (VSWIR imaging spectrometer) and Multispectral TIR NASA Mission Concept Studies. • Science, measurements, and algorithms have been demonstrated with airborne and ground measurements. • Compelling science questions: • - NRC Decadal Survey, • - 4th assessment of IPCC and • - U.S. Climate Change Science Program • - Community research • * High relevant heritage • * Low risk • * Modest cost. • Highly complementary to ACE, GEO-CAPE • HyspIRI Science Workshop: Aug 11-13, 2009, Pasadena, CA • URL: HTTP://HYSPIRI.JPL.NASA.GOV 10
Spectral Range 380 to 2500 nm in the solar reflected spectrum Sampling <= 10 nm {uniform over range} Response <= 10 nm (full-width-at-half-maximum) {uniform over range} Accuracy <0.5 nm Radiometric Range & Sampling 0 to 1.5 X max benchmark radiance, 14 bits measured Accuracy >95% absolute radiometric, 98% on-orbit reflectance, 99.5% stability Precision (SNR) See spectral plots at benchmark radiances Linearity >99% characterized to 0.1 % Polarization <2% sensitivity, characterized to 0.5 % Scattered Light <1:200 characterized to 0.1% Spatial Range >150 km (12 degrees at 700 km altitude) Cross-Track Samples >2500 Sampling <=60 m Response <=60 m sampling (FWHM) Uniformity Spectral Cross-Track >95% cross-track uniformity {<0.5 nm min-max over swath} Spectral-IFOV-Variation >95% spectral IFOV uniformity {<5% variation over spectral range} HyspIRI VSWIRScience Measurement Characteristics 11
HyspIRI TIR Science MeasurementsSummary Measurement Characteristics Spectral Bands (8) 3.98, 7.35, 8.28, 8.63, 9.07, 10.53, 11.33, 12.05 (µm) Bandwidth 0.084, 0.32, 0.34, 0.35, 0.36, 0.54, 0.54, 0.52 (µm) Accuracy <0.01 µm Radiometric Range Bands 2-8= 200K – 400K; Band 1= 1400K Resolution < 0.05 K, Linear Quantization to 14 bits Accuracy < 0.5 K 3-sigma at 250K Precision (NEdT) < 0.2K Linearity >99% characterized to 0.1 % Spatial IFOV 60 m MTF >0.2 at FNy Scan Type Whiskbroom Swath Width 600 km (±25.5° at 623 km altitude) 12
In Situ Spectral Measurements of Shallow Water Bottom Composition (E. Hochberg, Nova Southeastern University, FL)
Natural Color Image Habitat Composition Sand Coral Algae Science Questions Response to Disturbance Imaging spectroscopy is used to measure the functional types and fractions in a coastal coral ecosystem in order to ascertain the impacts of nutrients on habitat composition. James Goodman, UPRM Airborne imaging spectroscopy measurements of coral reef ecosystem, Hawaii. 14
Science QuestionsEcosystem Function and Diversity Perceived water color Phytoplankton Groups Spectral reflectance (sr-1) Chlorophyll a (mg m-3) Wavelength (nm) Phytoplankton groups have different pigment suites that give them unique spectral “fingerprints” that can be used to measure their presence and to understand their roles in aquatic ecosystems. 15 Dierssen et al. 2006