Download
1 / 18
180 likes | 201 Views
Explore prioritized flight missions to monitor the Earth system. Understand factors influencing future planning. Enhance hydrology research with NASA, NOAA, USGS.

E N D
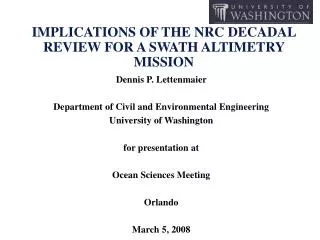
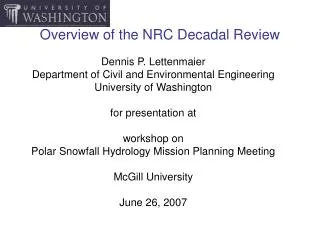
Dennis P. Lettenmaier Department of Civil and Environmental Engineering University of Washington for presentation at AGU Fall Meeting Special Session U.S. Contributions to International Hydrology December 10, 2007 IMPLICATIONS OF THE NRC DECADAL REVIEW FOR INTERNATIONAL HYDROLOGY
Decadal Review Charge Recommend a prioritized list of flight missions and supporting activities to support national needs for research and monitoring of the dynamic Earth system during the next decade. Identify important directions that should influence planning for the decade beyond. Sponsors: NASA SMD, NOAA NESDIS, USGS Geography
Soil Moisture SMAP Surface water/coastal oceanography (swath altimetry+) SWOT Cold land processes SCLP Groundwater/ocean mass (GRACE+) Water vapor transport (WOWS/AIRS+) Glacier mass balance/sea ice thickness Inland water quality Water Panel top 7 missions
And … a strong endorsement of Global Precipitation Measurement (GPM) “Precipitation arguably is the most important part of the global water cycle. It dominates the land surface branch of the water cycle, and is second only to evaporation over the oceans … “ The approved GPM mission was highest ranked by the water cycle panel
Bias in satellite precipitation estimates (no in situ adjustment) over La Plata basin, 2003-2005 The bias significantly decreased at the year 2005 over basins 3802 and 6598 for the three real-time satellite precipitation products. For details: Su et al (H32A07)
Recent Results: NWP Skill Sutton et al. (2007): Will Perturbing Soil Moisture Improve Warm-Season Ensemble Forecasts? A Proof of Concept, Monthly Weather Review, 134, 3174-3189. NOAA-FSL and NCAR Study “…changes to 5-km forecasts due to soil moisture differences were almost as large as the changes to 20-km forecasts due to using an alternate convective parameterization, previously determined to be a large source of uncertainty in ensemble forecasts…” “…The results presented here suggest that short-term temperature and precipitation forecasts can indeed be changed as a consequence of changing the soil moisture…”
Current Operational Drought Indices by NOAA and National Drought Mitigation Center (NDMC) Current NWS Operational Flash Flood Guidance (FFG) SMAP Flood and Drought Applications SMAP Primary Science Objective “…delivery of flash-flood guidance to weather forecast offices are centrally dependent on the availability of soil moisture estimates and observations.” “SMAP will provide realistic and reliable soil moisture observations that will potentially open a new era in drought monitoring and decision-support.” Decadal Survey: Current: Empirical Soil Moisture Indices Based on Rainfall and Air Temperature ( By Counties or ~30 km ) Future: SMAP Soil Moisture Observations at 10 km
Swath altimetry would “see” most global rivers and lakes, and would be able to recover useful altimetric information for surface areas > ~ 1 km2
Rivers and flood plains: a spatial view Global lake and reservoir storage: beyond the largest ~100s – 1000s
Channel Discharge Estimation Error using synthetic SWOT observations and EnKF 600 500 • Spatially averaged RMSE of channel discharge • Open-loop RMSE = 161.5 m3/s (23.2%) • Filter RMSE = 76.3 m3/s (10.0%) 400 300 RMSE (m3/s) 200 100 0 Apr 1 Apr 15 May 1 May 15 Jun 1 Jun 15 Details: Andreadis et al, GRL, 2007
Annual Accumulated Snowfall Annual Runoff NRC Decadal Survey Societal Challenge: Freshwater Availability Runoff Dominated by Water from Snowmelt • Over much of the industrialized world (1/6 of world’s population), 50-100% of runoff results from snowmelt1, affecting about a quarter of the global gross domestic product. • Scientists, managers and planners need to know how much water is in the snowpack.2 Snow Water Equivalent (SWE) Runoff Dominated by Snow1 • Understanding the dynamics of water storage in seasonal snowpacks is critical to the effective management of water resources both within the U.S. and globally.3 Red outline: Snowmelt dominated and lacks sufficient storage capacity to buffer shifts in seasonal hydrograph. 1Barnett et al, Nature (17), Nov 2005 2Anthes et al, p 4-39 3Anthes et al, p 4-38
SWE(cm) - 200 - 150 - 100 - 50 - 45 SWE (cm) 0 0.01 0.1 0.5 1 2.5 5 10 15 25 50 75 100 200 - 40 NSA > - 35 AMSR - 30 - 25 - 20 ( - 15 Annual Internal Renewable Water Resources (AIRWR) are average fresh water resources available over a year from precipitation falling within a country’s borders (Gleick et al., 1993). - 10 - 8 - 6 - 4 - 2 Neutral 0 + 2 + 4 NSA < + 6 + 8 AMSR + 10 + 15 + 20 NRC Decadal Survey Societal Challenge: Freshwater Availability Large Uncertainty of Current Snow Measurements Comparing in situ + airborne Estimate to Satellite NOAA National Snow Analysis (NSA) (AMSR SWE) - (NOAA NSA SWE) February 10, 2004 Total Volume of Water Stored, U.S. 258 km3 (11% AIRWR) Total Difference in Volume of Water Stored, U.S. -113 km3 (5% AIRWR) ) Preliminary information from “The Value of Snow and Snow Information Services” – Office of the Chief Economist (NOAA, 2004): “..improved snow information and services have potential benefits greater than $1.3 billion annually.” “…investments that make only modest improvements in snow information will have substantial economic payoffs.”
NRC Decadal Survey Societal Challenge: Improved Weather Prediction Science Example: Snow Cover Impacts Mesoscale Hydrometeorology Clear Sky Conditions No Snow Snow • Snow accumulation impacts the sensible heat flow for clear skies, and provides positive feedback on the cloud formation and snow melt. • SCLP will provide high resolution mapping of snow accumulation for improved surface parameterization for land-atmosphere interactions in mid and high latitudes during the winter-spring transitions, with implications for mesoscale hydrometeorology, terrestrial hydrology and carbon budgets. Lower sensible heat flux Higher sensible heat flux Lower potential temperature Higher potential temperature Shifting wind direction across the boundary Horizontal wind speed gradient Segal et al. (1992)
What are the implications for the U.S. and International Hydrology? • Global vs International Hydrology • Each of the four missions would have a large impact on hydrological sciences, and taken together would fundamentally change the field • The storm cloud on the horizon: NASA earth science funding • Can these missions go forward without international cooperation (something the U.S. doesn’t always do very well)? • And can we convince prospective international partners to adopt a policy of free and open data exchange (which the U.S. generally does better)?