Download
1 / 39
410 likes | 568 Views
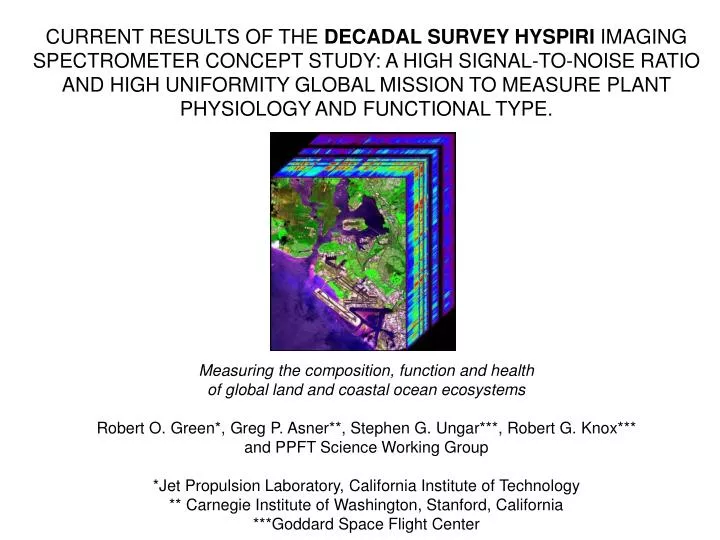
CURRENT Results of the Decadal Survey HyspIRI Imaging Spectrometer Concept Study: A High Signal-to-Noise Ratio and High Uniformity Global Mission to Measure Plant Physiology and Functional Type . Measuring the composition, function and health of global land and coastal ocean ecosystems

E N D
CURRENT Results of the Decadal Survey HyspIRIImaging Spectrometer Concept Study: A High Signal-to-Noise Ratio and High Uniformity Global Mission to Measure Plant Physiology and Functional Type. Measuring the composition, function and health of global land and coastal ocean ecosystems Robert O. Green*, Greg P. Asner**, Stephen G. Ungar***, Robert G. Knox*** and PPFT Science Working Group *Jet Propulsion Laboratory, California Institute of Technology ** Carnegie Institute of Washington, Stanford, California ***Goddard Space Flight Center
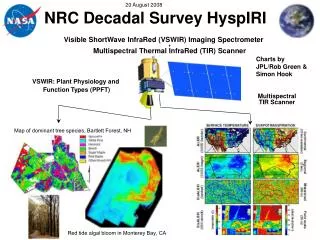
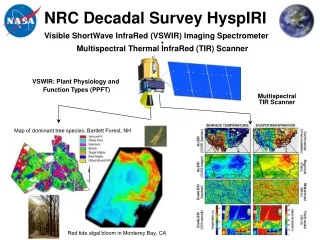
NASA Decadal Survey Mission HyspIRI Visible ShortWave InfraRed (VSWIR) Imaging Spectrometer+ Multispectral Thermal InfraRed (TIR) Scanner VSWIR: Plant Physiology and Function Types (PPFT) Multispectral TIR Scanner Map of dominant tree species, Bartlett Forest, NH Red tide algal bloom in Monterey Bay, CA
Plant Physiology and Functional Types NASA Mission Concept Study Science Questions: • What is the composition, function, and health of land and water ecosystems? • How are these ecosystems being altered by human activities and natural causes? • How do these changes affect fundamental ecosystem processes upon which life on Earth depends? Imaging spectrometer: 100kg / 67W Schedule: 4 year phase A-D, 3 years operations All components have flown in space Map of dominant tree species, Bartlett Forest, NH Measurement: • 380 to 2500 nm in 10nm bands • Accurate 60 m, 145 km swath • 19 days revisit at equator • Global land and shallow water Aquatic Terrestrial Red tide algal bloom in Monterey Bay, CA
Building on NASA Hyperion Technology Demonstration SNR > 10X Uniformity > 10X Wavelength Swath > 10X Cross Track Sample Soil C:N Ratio White Mountain National Forest, NH Global Coverage >> 10X
Overview • Science and Context • Science and Measurement • Mission Concept • Summary
Scientific and Societal Context The US National Academy of Sciences Decadal Survey (2007) placed “critical priority” on a: “Mission to observe distribution and changes in ecosystem function:An optical sensor with spectral discrimination greatly enhanced beyond the LANDSAT and MODIS class is required to detect and diagnose changes to ecosystem function such as water and nutrient cycling and species composition. Such observations include nutrient and water status, presence and responses to invasive species, health of coral reefs, and biodiversity. We propose a hyperspectral sensor with pointability for observing disturbance events such as fire and droughts when and where they occur at higher temporal frequency.”
Science Questions Topic Areas • Ecosystem Function and Diversity: • What are the spatial distributions of different plant functional groups, diagnostic species, and ecosystems? • How do their locations and function change seasonally and from year to year? • What are the trends? • Biogeochemical Cycles: • How do changes in the physical, chemical, and biotic environment affect the productivity, carbon storage and biogeochemical cycling processes of ecosystems? • How do changes in biogeochemical processes feed back to other components of the Earth system? • Ecosystem Response to Disturbance: • How do human-caused and natural disturbances affect the distribution, biodiversity and functioning of ecosystems? • Ecosystems and Human Well-being: • How do changes in ecosystem composition and function affect human health, resource use, and resource management?
Dar Roberts, et al, UCSB Vegetation Functional Type Analysis, Santa Barbara, CA MESMA Species Type 90% accurate Species Fractional Cover
Perceived water color Phytoplankton Groups Spectral reflectance (sr-1) Chlorophyll a (mg m-3) Wavelength (nm) Science QuestionsEcosystem Function and Diversity Phytoplankton groups have different pigment suites that give them unique spectral “fingerprints” that can be used to measure their presence and to understand their roles in aquatic ecosystems. Dierssen et al. 2006
Natural Color Image Habitat Composition Sand Coral Algae Science Questions Response to Disturbance Imaging spectroscopy is used to measure the functional types and fractions in a coastal coral ecosystem in order to ascertain the impacts of nutrients on habitat composition. James Goodman, UPRM Airborne imaging spectroscopy measurements of coral reef ecosystem, Hawaii.
Science QuestionsEcosystems and Human Well-Being Airborne imaging spectrometer measurements of a red tide algal bloom in Monterey Bay, CA A complete spectral measurement is required to determine the species type including species that cause potentially harmful algal blooms. October 2002 Ceratium spp. bloom Paul Bissett, Florida Environmental Research Institute. Spectral Signatures
Science Questions Response to Disturbance Non photosynthetic Vegetation Green vegetation Canopy Liquid Water Interannual changes in canopy moisture show significant stand age differences up to 30 years (shown as the difference in canopy moisture between spring98 and spring 97 –blue, and spring97 and spring 95 - green). These results indicate that seasonal drought response is age dependent in shrublands, with older stands less impacted by drought. These results require seasonal imaging spectroscopy observations. Post-fire response to three different fires, two in 1993 and one in 1996. Canopy moisture is the most sensitive measure of change, as shown by overlap between the 1996 and 1993 Calabasas and Topanga fires. High fire return intervals in Southern California are impacting ecosystems, eliminating some shrub species.
Science Response to Distrubance Cerro Grande Fire Severity, Los Alamos, NM, Ray Kokaly AVIRIS Ash/Charcoal Mineral/Ash Mineral-1mm Mineral-2mm Photo Dry Conifer Dry & Green Conifer Spectral Fitting Map Straw matting Straw matting & Green grass Lignin-Cellulose Lab Lignin-Cellulose AVIRIS Green Vegetation Ray Kokaly, USGS
The Complete PPFT Data Stream for Ecosystem Composition, Function and Health Invasive species and nitrogen-fixing PFT Soil nitrogen trace gas emissions Fractional material cover Invasive Species in the Hawaiian Rainforest from Airborne Imaging Spectrometer data: Patterns of Invasion and Biogeochemical Consequences Myrica infestations Canopy Modeling Radiative Transfer Leaf nitrogen concentration Biochemical Fingerprinting Biogeochemical Analysis Canopy water content Asner and Vitousek, PNAS Hall and Asner, GCB
Science QuestionsSummary • A set of overarching science question have been defined • What is the composition, function, and health of terrestrial and aquatic ecosystems? • How are these ecosystems being altered by human activities and natural causes? • How do these changes affect fundamental ecosystem processes upon which life on Earth depends? • These overarching questions are best addressed with detailed science question defined for each of the following topic areas • Ecosystem Function and Diversity • Biogeochemical Cycles • Ecosystem Response to Disturbance • Ecosystems and Human Well-Being • Antecedent measurements and derived products have been shown as pathfinder examples to address the PPFT overarching and topic area science questions.
Science RationaleThe Need for Continuous Spectral Measurements • Plant and phytoplankton functional types and species have biochemical and biophysical properties that are expressed as reflectance and absorption features spanning the spectral region from 380 to 2500 nm. • Individual bands do not capture the diversity of biochemical and biophysical signatures of plant functional types or species. • Changes in the chemical and physical configuration of ecosystems are often expressed as changes in the contiguous spectral signatures that relate directly to plant functional types, vegetation health, and species distribution. • Important atmospheric correction information and calibration feedback is contained within the spectral measurement.
Science RationaleSTM Ecosystem Function and Diversity Summary STM
Science RationaleSTM Biogeochemical Cycles Summary STM
Science RationaleEcosystem Response to Disturbance Summary STM
Science RationaleSTM Ecosystems and Human Well-Being Summary STM
Science Measurements Approach • Measure the global land and coastal/shallow water (> -50m). • 19 day equatorial revisit to generate seasonal and annual products. • Measure the molecular absorption and constituent scattering signatures in the spectral range from 380 to 2500 nm at 10 nm, and at 60 m spatial sampling. PPFT at 60 m
Science MeasurementsSummary Measurement Characteristics Spectral Range 380 to 2500 nm in the solar reflected spectrum Sampling <= 10 nm {uniform over range} Response <= 10 nm (full-width-at-half-maximum) {uniform over range} Accuracy <0.5 nm Radiometric Range & Sampling 0 to 1.5 X max benchmark radiance, 14 bits measured Accuracy >95% absolute radiometric, 98% on-orbit reflectance, 99.5% stability Precision (SNR) See spectral plots at benchmark radiances Linearity >99% characterized to 0.1 % Polarization <2% sensitivity, characterized to 0.5 % Scattered Light <1:200 characterized to 0.1% Spatial Range >145 km (12 degrees at 700 km altitude) Cross-Track Samples >2400 Sampling <=60 m Response <=60 m sampling (FWHM) Uniformity Spectral Cross-Track >95% cross-track uniformity {<0.5 nm min-max over swath} Spectral-IFOV-Variation >95% spectral IFOV uniformity {<5% variation over spectral range}
Science MeasurementsCharacteristics Continued Temporal Orbit Crossing 11 am sun synchronous descending Global Land Coast Repeat 19 days at equator Rapid Response Revisit 3 days (cross-track pointing) Sunglint Avoidance Cross Track Pointing 4 degrees in backscatter direction OnOrbit Calibration Lunar View 1 per month {radiometric} Solar Cover Views 1 per week {radiometric} Surface Cal Experiments 3 per year {spectral & radiometric} Data Collection Land Coverage Land surface above sea level excluding ice sheets Water Coverage Coastal zone -50 m and shallower Solar Elevation 20 degrees or greater Open Ocean Averaged to 1km spatial sampling Ice Sheets Averaged to 1km spatial sampling Compression >=3.0 lossless
Science MeasurementsKey SNR and Uniformity Requirements Required SNR Benchmark Radiances Uniformity Requirement Cross Track Sample Depiction -Grids are the detectors -dots are the IFOV centers -Colors are the wavelengths Requirement Spectral Cross-Track >95% cross-track uniformity {<0.5 nm min-max over swath} Spectral-IFOV-Variation >95% spectral IFOV uniformity {<5% variation over spectral range} Wavelength
Mission Concept PPFT Overview • Duration: 4 years implementation, 3 years science • Coverage: Global land and coast/shallow water every 19 days • 3 day event revisit capability • Data are acquired over all reasonably illuminated areas (Sun elevation > 20 deg). • Data download using dual-polarization X-band at high-latitude stations • Instrument: 67W, 100kg, 1.6X1.6X1 m • Spacecraft Example: LEO RSDO bus (SA-200HP) • Launch: Taurus-class launch vehicle.
Mission Concept Instrument: Offner SpectrometerLow Cost and High Fidelity • The instrument design selected is an Offner imaging spectrometer with extensive relevant heritage • Hyperion, CRISM, COMPASSair, TBair, ARTEMIS, M3 • At the core of the PPFT instrument is a pair of f/2.5, high signal-to-noise ratio, uniform, full-spectral-range Offner spectrometers • Each spectrometer has two full range detector arrays that cover the spectral range from 380 to 2500 nm @ 10 nm intervals with 610 cross-track spatial elements used • CRISM, TBair, ARTEMISfull_range, M3full_range One of two Offner spectrometers in the PPFT instrument 27 micron uniform e-beam slit Spherical Mirror Multi-blazé e-beam low scatter, low Plz. convex grating One of two full spectral range HgCdTe detector arrays 610 used cross-track 213 used spectral Spherical Mirror Uniform air slit Convex multi-blaze grating Full range Detector array and filter Order sorting filter
Mission Concept Instrument with Telescope with Spectrometers • The light from the PPFT telescope is field split in order to feed the two spectrometers (A,B). • In each spectrometer two detector arrays provide 610 cross-track by 213 spectral detector elements. • Each spectrum is read out as a snap-shot, so that there is no time delay, yaw, or jitter impact to the spectral-IFOV-uniformity • Total coverage 2400 cross-track by 213 spectral • Mirror coating for high reflectivity 380 to 2500 nm • Mirror surface specified for extremely low scatter • Mirror orientations and coatings specified to minimize polarization < 2% • Detectors and spectrometer are passively cooled
Mission ConceptHeritage: NASA Moon Mineralogy Mapper (M3) • 24 Month Build • -- Mouroulis Offner Design (PPFT) • -- Convex e-beam grating (PPFT) • -- 6604a MCT full range detector array, multiplexor & signal chain (PPFT) • -- Uniform slit (PPFT) • -- 0.5 micron adjustment mounts lockable for flight • - Aligned to 95% cross-track uniformity (PPFT) • - Aligned to 95% spectral IFOV uniformity (PPFT) • - Meets high SNR requirements (PPFT) • - Passive radiator (PPFT) M3 Spectrometer First spectrum 18 Months from funding start Spectral IFOV uniformity > 95% Mass 8 kg, Power 15 Watts Cross-track uniformity > 95%
Mission ConceptInstrument Calibration • Every week at the end of the sunlit pass, once the surface illumination is below threshold. The instrument cover will be brought to 45 degrees of the closed position and be illuminated by the sun with the spacecraft holding an inertially fixed attitude. • Once a month (fixed Moon phase), the spacecraft attitude will be adjusted during the eclipsed part of the orbit to make the Moon cross the instrument field-of-view. • Three times a year, calibration data of chosen test sites will be acquired. Solar Calibration Lunar Calibration Ground Calibration
Mission ConceptGround Data System Example approach (updated 16 July 2007) Instrument Science Team 1.6 Terabit memory 0.6 Terabit Orbit average 0.2 Terabits 3X compressed Science Data Processing and Distribution Center Level 1, 2 and selected Level 3 Multidisciplinary Science Team 640 Mb/s 7 minutes/orb Polar Ground Station X-band dual polarization 640 mbits/sec 7 min/orbit average
1.1 m 1.6 m Mission ConceptExample Launch Vehicle Example approach Taurus 3210 Capability to 694 km sun-sync (per KSC website): 765 kg 1.6 m
SummaryPlant Physiology and Functional Types Three fundamental components required for understanding ecosystems are: function, composition, and structure. This mission for the first time provides global measurements of function with vastly improved measures of composition including biodiversity. The science, measurements, and algorithms enabling this mission have been consistently demonstrated with antecedent airborne and ground measurements and experiments. This PPFT mission addresses a set of compelling science questions that have been repeatedly identified as critical to science and society by independent assessments and scientific panels. Recent examples include: the NRC Decadal Survey, the 4th assessment of the IPCC and the Millennium Ecosystem Assessment (2005). The PPFT instrument (24 Month build) and mission have high relevant heritage, and correspondingly low risk, in conjunction with a modest cost.
Plant Physiology and Functional Types NASA Mission Concept Study Science Questions: • What is the composition, function, and health of land and water ecosystems? • How are these ecosystems being altered by human activities and natural causes? • How do these changes affect fundamental ecosystem processes upon which life on Earth depends? Imaging spectrometer: 100kg / 67W Schedule: 4 year phase A-D, 3 years operations All components have flown in space Map of dominant tree species, Bartlett Forest, NH Measurement: • 380 to 2500 nm in 10nm bands • Accurate 60 m, 145 km swath • 19 days revisit at equator • Global land and shallow water Aquatic Terrestrial Red tide algal bloom in Monterey Bay, CA
Building on NASA Hyperion Technology Demonstration SNR > 10X Uniformity > 10X Wavelength Swath > 10X Cross Track Sample Soil C:N Ratio White Mountain National Forest, NH Global Coverage >> 10X