Download
1 / 34
380 likes | 723 Views
GEO 106: Environmental Geology. Brian McAninch. Topics to be covered:. Basic building blocks of geology & the environment Minerals and their chemistry Rocks and the rock cycle How the Earth works Plate tectonics The scientific method Hazards of the environment

E N D
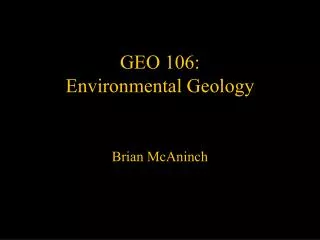
GEO 106: Environmental Geology Brian McAninch
Topics to be covered: • Basic building blocks of geology & the environment • Minerals and their chemistry • Rocks and the rock cycle • How the Earth works • Plate tectonics • The scientific method • Hazards of the environment • Earthquakes, volcanoes, flooding, landslides, and hurricanes • Our impact on the environment • On soil, water resources, and climate
What is the most valuable material that we mine on Earth? Mineral Resources
Mining for energy resources How do we mine For coal? What are the advantages and disadvantages of each?
Hazardous minerals What is this magnified mineral?
Earthquake damage in California
Landers (1992) Earthquake in SoCal (southern California)
Flooding on the Mississippi What’s the feature cutting across the bottom half of the picture?
Same confluence at the height of the 1993 flooding of the Mississippi and Missouri rivers
San Andreas Fault Los Angeles Orange County Combinations of natural and man-made disasters
Our impact on the environment: Soil Erosion
Water Resources: • water supply • water pollution
Temperature (o Celsius) Global Warming The famous ‘hockey stick’ graph
What can we do about these hazards and impacts on the environment by humans? Plan ahead. EQ Hazard map for Portland Oregon
Now for some examples • Cycles and systems • What is a system? • What are open & closed systems? • What are some examples? • What is environmental unity? • Population growth • What is linear & exponential growth? • What does sustainable mean? • Carrying capacity? • Human population growth • How many humans will there be in 40 years?
Exponential versus Linear Growth
Is the growing human population resulting in more disasters? What is causing this increase in the cost of natural disasters? In the U.S.
So how many people will there be in the future? Is this the major environmental concern for Earth?
UN estimates for human population growth Current estimate (2007) is for the peak to be approximately 9.2 billion in 2050, with the other estimates at 12, 10.8, and 7.9 billion.
And UN estimates for human population growth into the future
So why does the exponential growth of human slow and then peak?
China 1950-2000 From: International Institute for Applied Systems Analysis www.iiasa.ac.at Example of how short-term famine/death do not result in significant decrease in population
Rural versus Urban Population Current data from U.N. Dept of Economic & Social Affairs, Population Division (2007)
Projected Chinese population (in grey) and birthrates (in red). Note the substantial decline in birthrates (starting ~1970) resulting in the projected decline in population beginning around 2010-2020. From: International Institute for Applied Systems Analysis www.iiasa.ac.at
Projected population curves for China and India These are somewhat Inaccurate as are from 1996 China India From: International Institute for Applied Systems Analysis www.iiasa.ac.at