Download

1 / 16
160 likes | 228 Views
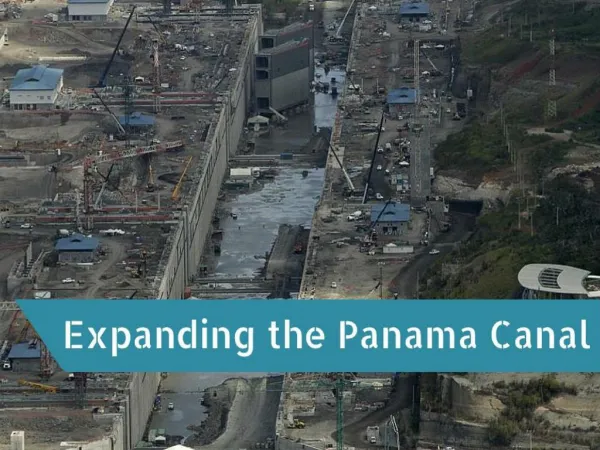
How Will Changing Rainfall Rates Affect the Panama Canal?. Jason Kaufman University of Alabama in Huntsville Climate 1-Stop Panama Excursion 01/08/2010. Project Discussion. Project Discussion. Project Discussion. Many different models and different scenarios

E N D
How Will Changing Rainfall Rates Affect the Panama Canal? Jason Kaufman University of Alabama in Huntsville Climate 1-Stop Panama Excursion 01/08/2010
Project Discussion • Many different models and different scenarios • I am using the Hadley A2 scenario for rainfall predictions in 2020, 2050 and 2080 • Estimate based on precipitation changes to determine how much less water will be in the watershed in the future
Process • Retrieving the data • Eric Anderson provided the data for the project from the SERVIR data banks • Current rainfall for the canal, and for the model predictions for the future • Also required elevation, land cover, soil moisture, and watershed data
Process • Data construction • Combine each month into a yearly rainfall dataset • Transform each dataset into a raster data set for use by N-SPECT • Compile in N-SPECT
N-SPECT • Nonpoint-Source Pollution and Erosion Comparison Tool • Designed to estimate water quality impacts from a variety of sources • One of these is climate change, hence its use here.
Assumptions • Due to time constraints, assumptions were needed • Precipitation scenario needed # of raining days for analysis. Assumed 100 days for current data, 95 in 2020, 85 in 2050 and 70 in 2080 • Using Type I rainfall (Similar to Hawaii)
Assumptions • Limit the number of water input sources
Data – Current and 2020 • Takes 52 million gallons of water to operate the dams in transit • 61,956,459,462 G/Yr at present • 1,192 trips possible • 12,855 made last year • Factor of 10.78 • 35,524,109,406 G/Yr in 2020 • 684 trips predicted • Corrected to 7,374 trips/year in 2020
Data – 2050 and 2080 • 22,105,957,359 G/Yr in 2050 • 424 trips predicted • Corrected to 4,571 trips/year in 2050 • 16,339,698,700 G/Yr in 2080 • 314 trips predicted • Corrected to 3,385 trips/year in 2080 • If this data holds true, only 26.3% of the ships that currently transit the Canal would be able to in 2080
Future Canal Operations • Plans are underway to improve transit • Water basins on new locks will reduce water use by 60%, meaning a transit will now only take 20.8 million gallons. • Current: 2,980 predicted -> 32,138 trips/year (12,855 currently) • 2020: 1,710 predicted -> 18,435 trips/year (7,374 predicted) • 2050: 1,060 predicted -> 11,428 trips/year (4,571 predicted) • 2080: 785 predicted -> 8,463 trips/year (3,385 predicted)
Thanks • Thank you to Eric Anderson for providing the data • Thank you to SERVIR and CATHALAC for hosting us and providing us data • Thank you to IAGT, CCC and UAH for planning the trip and getting all of us down here • Thank you all for being here