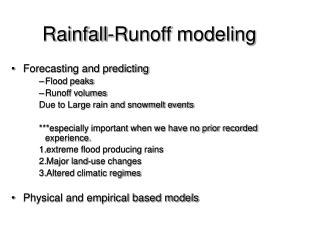
Rainfall Records
Rainfall Records. Professor Steve Kramer. Rainfall Records. Measured at single point by rain gauge Over extended period of time, can establish: Mean annual rainfall Standard deviation of annual rainfall. Mean + s. Mean. Mean - s. Rainfall Records.

Rainfall Records
E N D
Presentation Transcript
Rainfall Records Professor Steve Kramer
Rainfall Records • Measured at single point by rain gauge • Over extended period of time, can establish: • Mean annual rainfall • Standard deviation of annual rainfall Mean + s Mean Mean - s
Rainfall Records • Rainfall also varies substantially within each year Atlanta - wet years Cleveland - wet summers SF – dry summers LV – dry years
Rainfall Records • Rainfall also varies within a rainy season • Few areas (other than Seattle) have continuous rainfall • In many areas, most precipitation occurs in large storms with: • Intense rainfall • Limited duration • Limited frequency • Useful to quantify intensity-duration-frequency relationship • Basic concept of hydrology • Useful for flooding, water resource evaluation • Also useful for rainfall-induced landslide prediction
Rainfall Records • For a given rain gauge, list precipitation data from significant storms in N years
Rainfall Records 7 For a given rain gauge, list precipitation data from significant storms in N years
Rainfall Records 7 For a given rain gauge, list precipitation data from significant storms in N years
Rainfall Records 10-min duration events 7 For a given rain gauge, list precipitation data from significant storms in N years
Rainfall Records • Choose a particular duration (say 10 min) • List maxima for all storms in order of decreasing rainfall (most intense 10 min for each)
Rainfall Records Every 30 years, on average, we can expect to see more than 0.66 inches of rainfall in a 10-min period of time • Choose a particular duration (say 10 min) • List maxima for all storms in order of decreasing rainfall (most intense 10 min for each)
Rainfall Records Every 15 years, on average, we can expect to see more than 0.60 inches of rainfall in a 10-min period of time • Choose a particular duration (say 10 min) • List maxima for all storms in order of decreasing rainfall (most intense 10 min for each)
Rainfall Records Every 1.07 years, on average, we can expect to see more than 0.12 inches of rainfall in a 10-min period of time • Choose a particular duration (say 10 min) • List maxima for all storms in order of decreasing rainfall (most intense 10 min for each)
10-min duration events Rainfall Records • Repeat for other durations • As duration increases, rainfall amount (in) goes up
Rainfall Records 15-min duration events • Repeat for other durations • As duration increases, rainfall amount (in) goes up
Rainfall Records 20-min duration events • Repeat for other durations • As duration increases, rainfall amount (in) goes up
Rainfall Records 40-min duration events • Repeat for other durations • As duration increases, rainfall amount (in) goes up
Rainfall Records • Repeat for other durations • As duration increases, rainfall amount (in) goes up • As duration increases, rainfall intensity (in/hr) goes down • Eventually , will generate intensity-duration-return period “triples” • Common to plot contours of constant Tr on intensity-duration plot
Rainfall Records • Repeat for other durations • As duration increases, rainfall amount (in) goes up • As duration increases, rainfall intensity (in/hr) goes down • Eventually , will generate intensity-duration-return period “triples” • Common to plot contours of constant Tr on intensity-duration plot
1 hr Every 2 yrs, can expect more than 1.2 inches of rainfall in one hour
1 hr Every 3 yrs, can expect more than 1.6 inches of rainfall in one hour
1 hr Every 10 yrs, can expect more than 2.0 inches of rainfall in one hour
1 hr Every 100 yrs, can expect more than 3.0 inches of rainfall in one hour Note similarity to seismic hazard curve, which showed return periods for exceeding different levels of ground shaking Low levels of rainfall intensity (or ground motion) are exceeded relatively frequently (short return period) High levels of rainfall intensity (or ground motion) are exceeded only rarely
Rainfall Records • Can use to plot rainfall maps 2-yr, 30-min rainfall 2-yr, 1-hr rainfall 100-yr, 1-hr rainfall 100-yr, 30-min rainfall
Rainfall Records 2-yr, 30-min rainfall Seattle 0.3 in San Francisco 0.8 in Houston 2.0 in Boston 0.9 in Chicago 1.1 in Can use to plot rainfall maps
Rainfall Records 2-yr, 1-hr rainfall Seattle 0.4 in San Francisco 1.0 in Houston 2.4 in Boston 1.1 in Chicago 1.5 in Can use to plot rainfall maps
Rainfall Records 100-yr, 30-min rainfall Seattle 0.8 in San Francisco 2.0 in Houston 3.6 in Boston 2.1 in Chicago 2.2 in Can use to plot rainfall maps
Rainfall Records 100-yr, 1-hr rainfall Seattle 1.0 in San Francisco 2.5 in Houston 4.6 in Boston 2.8 in Chicago 2.7 in Can use to plot rainfall maps
Contours of planar surface Slope Stability Evaluation • Involved, multi-disciplinary process (to do it right) • Identification of problem • Maps – topographic and geologic
Ground moving down Ground moving up Slope Stability Evaluation • Involved, multi-disciplinary process (to do it right) • Identification of problem • Maps – topographic and geologic
Slope Stability Evaluation • Involved, multi-disciplinary process (to do it right) • Identification of problem • Maps – topographic and geologic
Slope Stability Evaluation • Involved, multi-disciplinary process (to do it right) • Identification of problem • Maps – topographic and geologic • Airphotos – stereo-paired photograph interpretation
Slope Stability Evaluation • Involved, multi-disciplinary process (to do it right) • Identification of problem • Maps – topographic and geologic • Airphotos – stereo-paired photograph interpretation • Installation and observation of instrumentation • Survey monuments – benchmarks checked at regular intervals • Tiltmeters – placed on ground surface, structures to detect rotation • Inclinometers – measure lateral displacements in vertical hole
Slope Stability Evaluation • Involved, multi-disciplinary process (to do it right) • Field reconnaissance • Cracks in ground • Differences in vegetation • Seepage
Slope Stability Evaluation • Involved, multi-disciplinary process (to do it right) • Field reconnaissance • Cracks in ground • Differences in vegetation • Seepage • Hummocky terrain
Slope Stability Evaluation • Involved, multi-disciplinary process (to do it right) • Field reconnaissance • Cracks in ground • Differences in vegetation • Seepage • Hummocky terrain • Leaning trees • Displaced pipes, fences, etc.
Slope Stability Evaluation • Involved, multi-disciplinary process (to do it right) • Subsurface exploration • Geophysical methods (e.g., seismic refraction)
Slope Stability Evaluation • Involved, multi-disciplinary process (to do it right) • Subsurface exploration • Geophysical methods (e.g., seismic refraction) • Drilling and sampling
Slope Stability Evaluation • Involved, multi-disciplinary process (to do it right) • Subsurface exploration • Geophysical methods (e.g., seismic refraction) • Drilling and sampling • Evaluation of soil properties • Field testing – insitu strength measurement
Slope Stability Evaluation • Involved, multi-disciplinary process (to do it right) • Subsurface exploration • Geophysical methods (e.g., seismic refraction) • Drilling and sampling • Evaluation of soil properties • Field testing – insitu strength measurement • Laboratory testing – direct shear, triaxial, etc.
Perform analyses Slope Stability Evaluation • Involved, multi-disciplinary process (to do it right) • Subsurface exploration • Geophysical methods (e.g., seismic refraction) • Drilling and sampling • Evaluation of soil properties • Field testing – insitu strength measurement • Laboratory testing – direct shear, triaxial, etc • Stability analysis • Identify (idealize) problem geometry • Identify (idealize) strength properties • Identify (idealize) loading conditions
Slope Stability Evaluation • Involved, multi-disciplinary process (to do it right) • Evaluation/interpretation of results • Recommendations - Allowable slope angles, heights, rates of construction - Required soil improvement • Decisions - Consequences of failure - Methods of remediation - Cost of remediation
Resisting force FS = Driving force Slope Stability Analysis • Requires comparison of capacity and demand • Capacity – measure of resistance to significant downslope deformation • Demand – measure of loading causing downslope deformation • All methods are based on equilibrium analysis • Potentially unstable zone treated as free body • Evaluate driving (destabilizing) forces or stresses • Evaluate resisting (stabilizing) forces or stresses • Express “state” of stability, most commonly in terms of
Slope Stability Analysis • Requires comparison of capacity and demand • Capacity – measure of resistance to significant downslope deformation • Demand – measure of loading causing downslope deformation • All methods are based on equilibrium analysis • Potentially unstable zone treated as free body • Evaluate driving (destabilizing) forces or stresses • Evaluate resisting (stabilizing) forces or stresses • Express “state” of stability, most commonly in terms of Resisting force Average available shear strength FS = = Driving force Average shear stress required for equilibrium
t Displacement Slope Stability Analysis • Limit equilibrium analyses used • Assumes material above failure surface is rigid • Assumes elastic-perfectly plastic behavior • No deformation required to mobilize strength • No loss of strength with increasing deformation
b b z g, f Sliding surface Slope Stability Analysis • Limit equilibrium analyses used • Consider infinite slope in frictional soil W T N
For equilibrium, T b b W N b z g, f Slope Stability Analysis • Limit equilibrium analyses used • Consider infinite slope in frictional soil W W = gbz N = W cos b = gbz cos b T = W sin b = gbz sin b T N
For equilibrium, T b b W N b z g, f Slope Stability Analysis • Limit equilibrium analyses used • Consider infinite slope in frictional soil W T • Driving force • FD = W sin b = gbz sin b • Resisting force • FR = N tan f = gbz cos b tan f N
For equilibrium, T b b W N b z g, f gbz cos b tan f = gbz sin b FR tan f FS = = FD tan b Slope Stability Analysis • Limit equilibrium analyses used • Consider infinite slope in frictional soil W T N
Slope Stability Analysis • Limit equilibrium analyses used • Consider infinite slope in general soil b zw c, f, gsat gm z Seepage forces