
Decadal and Interdecadal Sea Level Variability in the Mediterranean and Northeastern Atlantic
The VANIMEDAT project investigates sea level variability surrounding the Iberian Peninsula, focusing on decadal and interdecadal changes. Funded by the Spanish Ministry of Science and Education, the project aims to characterize spatial and temporal sea-level variations, quantify driving mechanisms, and estimate ocean mass increase. The research utilizes data from tide gauges, altimetry, and ocean models (HAMSOM, MOG2D) while comparing these to understand long-term trends. Initial results and ongoing work highlight the integration of data sources to enhance sea level understanding.

Decadal and Interdecadal Sea Level Variability in the Mediterranean and Northeastern Atlantic
E N D
Presentation Transcript
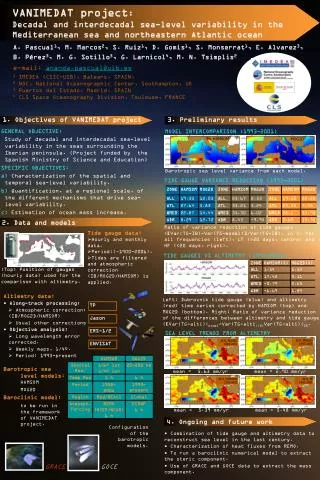
VANIMEDAT project: Decadal and interdecadal sea-level variability in the Mediterranean sea and northeastern Atlantic ocean A. Pascual1, M. Marcos2, S. Ruiz1, D. Gomis1, S. Monserrat1, E. Alvarez3, B. Pérez3, M. G. Sotillo3, G. Larnicol4, M. N. Tsimplis2 e-mail: ananda.pascual@uib.es 1 IMEDEA (CSIC-UIB), Balears, SPAIN, 2 NOC, National Oceanographic Center, Southampton, UK 3 Puertos del Estado, Madrid, SPAIN 4 CLS Space Oceanography Division, Toulouse, FRANCE 1. Objectives of VANIMEDAT project 3. Preliminary results GENERAL OBJECTIVE: Study of decadal and interdecadal sea-level variability in the seas surrounding the Iberian peninsula. (Project funded by the Spanish Ministry of Science and Education) SPECIFIC OBJECTIVES: a) Characterization of the spatial and temporal sea-level variability. b) Quantification, at a regional scale, of the different mechanisms that drive sea-level variability. c) Estimation of ocean mass increase. MODEL INTERCOMPARISON (1993-2001) HAMSOM MOG2D Barotropic sea level variance from each model. TIDE GAUGE VARIANCE REDUCTION (1993-2001) 2. Data and models Ratio of variance reduction at tide gauges ([Var(TG-IB)-Var(TG-model)]/Var(TG-IB), in %, for all frequencies (left), LF (>20 days, centre) and HF (<20 days, right). • Tide gauge data: • Hourly and monthly data. • Period:(~1900-2006). • Tides are filtered and atmospheric correction (IB/MOG2D/HAMSOM) is applied. TIDE GAUGES VS ALTIMETRY (1993-2001) HAMSOM (Top) Position of gauges (hourly data) used for the comparison with altimetry. MOG2D • Altimetry data: • Along-track processing: • Atmospheric correction: (IB/MOG2D/HAMSOM) • Usual other corrections • Objective analysis: • Long wavelength error corrected. • Weekly maps, 1/4º. • Period: 1993-present Left: Dubrovnik tide gauge (blue) and altimetry (red) time series corrected by HAMSOM (top) and MOG2D (bottom). Right: Ratio of variance reduction of the differences between altimetry and tide gauge ([Var(TG-alti)|model-Var(TG-alti)|]/Var(TG-alti)|IB. TP Jason ERS-1/2 SEA LEVEL TRENDS FROM ALTIMETRY ALTI_MOG2D 1993-2006 ALTI_MOG2D 1993-2001 ENVISAT Barotropic sea level models:HAMSOM MOG2D Baroclinic model: to be run in the framework of VANIMEDAT project. mean = 5.63 mm/yr mean = 2.90 mm/yr ALTI_HAMSOM 1993-2001 ALTI_IB 1993-2001 mean = 5.39 mm/yr mean = 5.48 mm/yr 4. Ongoing and future work Configuration of the barotropic models. • Combination of tide gauge and altimetry data to reconstruct sea level in the last century. • Characterization of heat fluxes from REMO. • To run a baroclinic numerical model to extract the steric component. • Use of GRACE and GOCE data to extract the mass component. GRACE GOCE