Download
1 / 10
100 likes | 287 Views
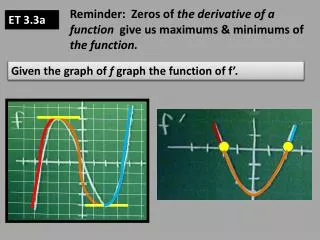
ET 3.3a. Given the graph of f graph the function of f’. Reminder: Zeros of the derivative of a function give us maximums & minimums of the function. Graphical Observations. Increasing x 1 < x 2 f(x 1 ) < f(x 2 ). On interval (a , b).

E N D
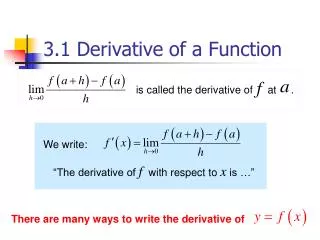
ET 3.3a Given the graph of f graph the function of f’. Reminder: Zeros of the derivative of a function give us maximums & minimums of the function.
Graphical Observations Increasing x1 < x2 f(x1) < f(x2) On interval (a , b) f ’(x) > 0 f increasing Decreasing x1 < x2 f(x1) > f(x2) f ’(x) < 0 f decreasing f ’(x) = 0 f constant
Algebraic Look Create intervals around critical #s f’(x) > 0 Test # f (x) is increasing + 2 Relative Max @ x = -2 Critical #s Test # f’(x) < 0 f (x) is decreasing Relative Min @ x = 2 f’(x) > 0 Test # f (x) is increasing
In summary If f’(c) changes from positive to negative at c, then c is a relative maximum. If f’(c) changes from negative to positive at c, then c is a relative minimum.
Create intervals around critical #s Find the relative max & minsof f’(x) < 0 Test # f (x) is decreasing Test # f’(x) < 0 f (x) is decreasing Relative Min @ x = 3/2 f’(x) > 0 Test # f (x) is increasing
Assignments 3.3 • Day 1 & Day 2: 5, 7, 19, 27, 31, 33, 39, 43, 59-62, 71-73, 79, 89, 93, 99-103
ET 3.3b Can you take the derivative using your calculator? If so do it. Play around with your calculator and see if you discover anything new regarding derivatives that you didn’t know before.
TI -83/84: Draw Derivative(Can’t find eq. using 84) • To draw the graphs of derivatives : • To draw the graph of the derivative of a function, first enter the function in Y1. Graph the function, making sure that you have a good viewing rectangle. • Then in Y2 enter nDeriv(Y1, x, x). (Remember that nDeriv is found in the MATH menu. Y1 is found in VARS, then arrow right to Y-Vars, then choose 1:Function, and then the function number for which you wish to graph the derivative.) • Push GRAPH . The calculator will graph both the function and its derivative. The graph of the derivative will be rather slow, since the calculator must calculate the numeric value of the derivative of each value of x for which it plots a point.
Assignments 3.3 • Day 1 & Day 2: 5, 7, 19, 27, 31, 33, 39, 43, 59-62, 71-73, 79, 89, 93, 99-103