Download
1 / 1
10 likes | 142 Views
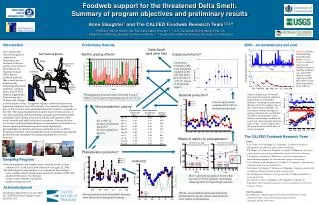
Foodweb support for the threatened Delta Smelt: Summary of program objectives and preliminary results Anne Slaughter 1 and The CALFED Foodweb Research Team 1,2,3,4 1 Romberg Tiburon Center, San Francisco State University • 2 U.S. Geological Survey, Menlo Park, CA

E N D
Foodweb support for the threatened Delta Smelt: Summary of program objectives and preliminary results Anne Slaughter1 and The CALFED Foodweb Research Team1,2,3,4 1 Romberg Tiburon Center, San Francisco State University •2 U.S. Geological Survey, Menlo Park, CA 3 Department of Biology, Georgia Southern University • 4 Department of Marine Sciences, University of Connecticut 0 20 San Francisco Estuary Benthic grazing effects6 Kilometers Sacramento River CA San Pablo Bay net Delta outflow (1000 m3s-1) Suisun Bay growth rate d-1 Carquinez Strait San Joaquin River sampling area 0.5-5 psu Mar-Aug 2006 San Francisco Phytoplankton biomass rarely exceeded 10 µg L-1 unless Corbula amurensis grazing was <0.3 m3 m-2 d-1 (Data based on analyses of DWR D7 bivalve samples and chl a values, shallow water of Grizzly Bay) Bacterial production5 Free-living bacteria contributed 67-93% to bacterial production Phytoplankton growth rate (day -1) Microzooplankton grazing rate (day -1) grazing/ growth Microzooplankton grazing7 Mar 14 0.19 0.04 21% Mar 21 0.41 0.17 42% Apr 11 0.51 0.19 38% Apr 18 0.69 0.06 9% 9% to 84% of primary production passed to microzooplankton grazers May 02 0.92 0.18 20% May 09 0.83 0.14 17% Jul 11 1.97 1.66 84% Jul 18 1.73 1.21 70% Aug 15 1.59 1.12 71% Aug 22 1.21 0.52 43% Skeletonema spp. Saline(5 psu) cells 0.5, 2, 5 psu Scenedesmus spp. Fresh (0.5 psu) cells 0.5, 2, 5 psu Phytoplankton production4 chlorophyll (µg L-1) Nutrients2 Hours Hours 0.5 psu 0.5 psu Treatments 2.0 psu More saline phytoplankton lysed when exposed to lower salinities, potentially releasing DOC for bacterial production 2.0 psu 5.0 psu 5.0 psu nitrate (µM) chlorophyll (µg L-1) Mar Apr May Jun Jul Aug Several peaks in total chlorophyll biomass were observed in spring and summer Nitrate concentrations decreased following phytoplankton peaks; nitrate concentrations were similar at all salinities Introduction Preliminary Results 2006 – an anomalously wet year Delta Smelt (and other fish) This collaborative research program is underway to characterize the foodweb of the low salinity zone (LSZ) of the northern San Francisco Estuary (SFE). Recent evidence indicates that several species of estuarine fish, including Delta Smelt (and their copepod prey), may be food limited, suggesting a link between their declines and changes Red lines indicate field sampling period for this project. Green numbers indicate rank of each month (in terms of monthly outflow); e.g., April 2006 was the wettest April since 1980, May 2006 was the third wettest May since 1980, etc. Copepod production3 Limnoithona tetraspina isthe most abundant copepod in the LSZ and had a growth rate of ~10% d-1 (mean of all juvenile stages) Surface salinity (top; horizontal lines represent nominal salinities) and position of each station (bottom), including X2 (calculated distance, from the Golden Gate, of the 2 psu bottom isohaline). X2 and surface salinity diverged in spring, primarily due to collection of surface measurements when salinity was strongly stratified; X2 is also not well-predicted when less than ~55 km. Later in the season, the 2 psu distance and X2 were in closer agreement. at lower trophic levels. Exogenous organic carbon likely provides important support to the LSZ foodweb. Our research examines the base of the foodweb, from phytoplankton and bacteria to copepods, in the LSZ. The data presented here resulted from the first year of a 2-year field sampling and experimental program that included weekly sampling cruises during two periods (spring and summer) when larval, juvenile and adult delta smelt are present. During this time, we focused on the potential influence of ammonium concentration on nitrate uptake (and therefore growth of phytoplankton), phytoplankton production and lysis (a potential source of DOC), bacterial production, microzooplankton and zooplankton grazing and production and abundance of and grazing impact by Corbula amurensis. The CALFED Foodweb Research Team Effects of salinity on phytoplankton1 Posters 1 R.A. Cohen, A.M. Slaughter, E.J. Carpenter. The effects of salinity on phytoplankton and dissolved organic carbon availability. 2 V.E. Hogue, A.E. Parker, R. Dugdale, A. Marchi, F. Wilkerson. The role of excess ammonium in reducing phytoplankton in the San Francisco Estuary. 3 T.R. Ignoffo, A.Gould, W.J. Kimmerer. Growth and development of Limnoithona tetraspina, the most abundant copepod in the estuary. 4 U.E. Lidstrom, A.M. Slaughter, R.A. Cohen, E.J. Carpenter. Phytoplankton production within the Low Salinity Zone. 5 A.E. Parker, V.E. Hogue, F. Wilkerson, R. Dugdale. Evaluating the potential contribution of bacterial carbon for higher trophic levels. 6 J.K. Thompson, F. Parchaso. Grazing potential of Corbula amurensis on lower trophic levels. 7 J.K. York, B. Costas, G. McManus, A.M. Slaughter, T. Ignoffo, W. Kimmerer. Microzooplankton dynamics in the Low Salinity Zone of the San Francisco Estuary. Oral Presentation W.J. Kimmerer. Foodweb support for the threatened delta smelt: Subtle interactions may be a cause of the pelagic organism decline.(Tuesday 1:10 PM, POD session) Sampling Program • Water and plankton net samples were collected weekly at three salinities (0.5, 2 and 5 psu) from March 14 to August 23, 2006. • The following data and samples were collected at each salinity: • water column salinity, temperature and clarity profiles (CTD with attached PAR sensor, Secchi disk) • surface water collection via bucket • plankton (ring) net tows Acknowledgment Funding for this project was providedby CALFED Science Program Grant #SCI-05-C107