Microclimate Study
Microclimate Study. Done by: Wang Xiang Yu Sun Tian Ze Thio Leng Kiat Zhao Xing Yu. Introduction. Over the period of two sessions, each lasting about 30 minutes, our group has gathered and compiled data from 7 different spots in the school compound. Hypothesis:

Microclimate Study
E N D
Presentation Transcript
Microclimate Study Done by: Wang Xiang Yu Sun Tian Ze Thio Leng Kiat Zhao Xing Yu
Introduction Over the period of two sessions, each lasting about 30 minutes, our group has gathered and compiled data from 7 different spots in the school compound. Hypothesis: Areas with concrete surfaces are hotter than non-concrete places.
Area 1: Multi-Storey Car Park • The top level of the Multi-Storey Car Park: • Exposed to sunlight • Has no shade apart from the occasional clouds • The surface is mainly made of concrete and tar.
Area 2: Eco-Garden The garden: • Wide variety plants ranging from small bushes to tall trees • Area is small in size • Buildings and trees near the eco-garden provide little to no shade. • The walkway near the garden is also made of concrete and stone.
Area 3: Open Space Open space near canteen: • Well shielded from the sun • The trees, which has long branches, and Block C, provide much shade;with the clouds they can keep the whole area almost fully shaded • The tiles and steps are also made of concrete and stone.
Area 4: Terraces The terraces: • Mainly situated at a high elevation point • The top of the terraces is covered by the trees and thus has very little sunlight;however, apart from that, the place is fully exposed to the sun with only the clouds to use as cover • Due to that, the place also enjoys a steady and strong breeze which helps to cool the place. • It is also made with concrete and stone.
Area 5: Field The field: • A very large, open space covered with grass and receives much • Sunlight • Much cooler than concrete areas as the vegetation evapotranspire, lowering surface and air temperatures • The area receives a lot of sunlight and has a strong cool breeze blowing with nothing blocking its path.
Area 6: Running Track The running track: • Made of synthetic rubber and outlines the entire field • Has no shade and thus is exposed to a lot of sunlight and so one will feel quite hot during the day.
Area 7: Fountain The fountain: • Has a small water body, and a moderate amount of vegetation nearby • The area surrounding the fountain and the fountain itself is mainly made of concrete or stone tiles • The water has a large thermal capacity, allowing it to store lots of thermal energy on hotter days and so keeps • the surrounding cooler • Thus, even though the area is subjected to • direct sunlight, it is still quite cooling.
Data of temperatures(1) Day 1/Date: 14/1/14 Time Conducted: 0800-0900 Sites Temperature 15cm 1.5m above above ground ground A 26.9 27.2 B 27.1 27.2 C 27.3 27.4 D 26.2 26.3 E 26.6 26.9 F 27.2 27.5 G 27.1 27.2
Data of temperatures(2) Day 2/ Date: 16/1/14 Time conducted: 1245-1300 Sites Temperature 15cm 1.5m From the data analysed, we can above above infer that at a later time of the ground ground day, the temperatures at the A 30.5 30.7 respective sites are observed B 30.8 30.9 to be hotted than at an earlier C 29.7 30.0 time of the day(morning). D 30.6 29.5 E 31.7 31.7 F 31.5 32.3 G 30.9 30.9
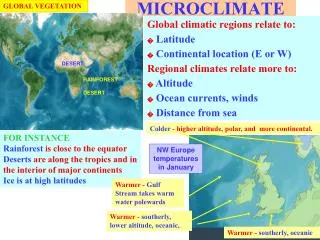
Factors Affecting Temp. Latitude Altitude Distance from water body Wind Humidity Cloud Cover Land Surface
Ranking We have ranked the places according to their temperature, with 1 being the hottest and 7 being the coolest. 1. E: 29.2 2. B: 29.0 3. G: 29.0 4. A: 28.8 5. D: 28.2 6. F: 29.6 7. C: 28.6
Hypothesis correction Our hypothesis is incorrect. The hottest areas were not concrete areas but areas like the field and the track. Human error, experiment errors and time would have affected the surrounding temperature. Fortunately it didn’t rain on the days we conducted the experiment, thus rainfall should not be one of the factors. We could be more precise and accurate in collecting data the next time and maybe do the experiments a few more times to ensure our data is accurate and reliable.