Download
1 / 19
200 likes | 457 Views
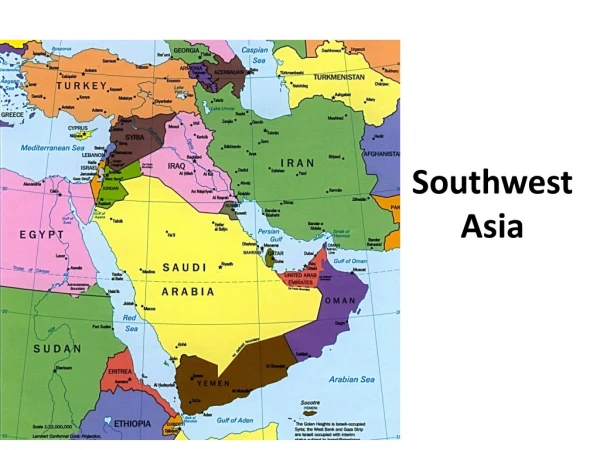
Observation Impact on WRF Model Forecast Accuracy over Southwest Asia. Michael D. McAtee Environmental Satellite Systems Division (ESSD) User Applications and Integration (UA&I) The Aerospace Corporation. ESSD/UA&I May 2014. Approved for Public Release – Distribution Unlimited . Overview.

E N D
Observation Impact on WRF Model Forecast Accuracy over Southwest Asia Michael D. McAteeEnvironmental Satellite Systems Division (ESSD) User Applications and Integration (UA&I) The Aerospace Corporation ESSD/UA&I May 2014 Approved for Public Release – Distribution Unlimited
Overview • Observation Impact Assessment Tool History and Description • System Configuration for Southwest Asia • Impact Results • Period Averages for “conventional” and satellite data • Special focus SSMIS, CrIS, ATMS, GPS RO • Summary and Future Work
Impact Tool History and Description Forecast Sensitivity to Observations • Based on results presented in a JCSDA newsletter, Air Force Weather Agency (AFWA) personnel were encouraged to pursue the development of an observation impact assessment tool based on techniques developed at the Naval Research Laboratory (NRL) • AFWA tasked the National Center for Atmospheric Research (NCAR) with developing such a tool that could be used with its operational forecast model and data assimilation system (WRF and WRF DA) leveraging previous work that had been done to develop 4DVAR • Aerospace working with NCAR, AFWA and its contractors installed the system in AFWA’s development environment
Impact Tool History and Description Forecast Sensitivity to Observations • The tool, which is called Forecast Sensitivity to Observations (FSO), has the ability, using adjoint methods, to quantitatively estimate the impact that assimilating observations has on short-range WRF model forecast accuracy • An FSO capability was subsequently developed by NCAR for AFWA that works with the Gridpoint Statistical Interpolation (GSI) system • The FSO system used in this study consists of the GSI with Lanczos minimization, WRF, and the adjoint to WRF
The Case for FSO? Forecast Sensitivity to Observations • Meets a need to know not only the impact of observations but also their relative value • A single run of FSO can provide the relative value of all observations assimilated without the need for multiple and computationally expensive with- and without- model runs • FSO can provide the critical information needed to intelligently select which channels from space based remote sensors will be assimilated • FSO can be used to monitor the health of an NWP center’s data assimilation system as well as the health of the observations it uses • FSO can determine which individual observations improved or degraded the forecast
Forecast Error Sensitivity wrt Potential Temperature FSO Configuration • AFWA SW Asia Domain (T4) • WRF (v3.5), GSI (v3.2 with Lanczos minimization) • 45 km grid spacing • 57 levels, model top 10 mb • Limited data assimilation (DA) cycle • DA Cycle times: 00,06,12,18 UTC • 12 hour forecast length • Dry energy forecast error metric • Impact computed for sub region • Study period 1-18 March 2014 for 00 and 12 UTC cycles (oK) F=
AIRCFT Sound FSO Configuration • Observations Assimilated • Aircraft reports(AIRCFT) • Radiosondes (Sound) • Atmospheric motion vectors from geostationary satellites (SATWND) • Surface observations (METAR, Synop) SATWND Low Level SATWND Upper Level Synop METAR
GPS SFCSHP FSO Configuration • Observations Assimilated Ships and buoys (SFCSHP) GPS bending angle (COSMIC) AMSUA (Aqua,N15,N18,N19) MHS (N18,N19) AIRS (Aqua) IASI (MetOp-A) AMSUA N19 MHS N19 AIRS IASI
HIRS FSO Configuration • Observations Assimilated SSMIS F17 HIRS/4 (N19, MetOp-A) SSMIS*(F17, F18) ATMS* (NPP) CrIS* (NPP) *Not Operationally Assimilated at the time of the study ATMS CrIS
FSO Configuration Variational Bias Correction
Observation Impact Results Period Average Impact and Total Count by Observation Parameter Radiance observations have the greatest total impact largely based on the strength of their numbers and coverage The impact of all non-radiance observation types is ~25% of the total impact Larger Impact
Observation Impact Results Period Average Impact per Observation GPS largest impact per observation Surface Pressure also has a very large impact per observation Radiance data has a relatively small impact per observation
Observation Impact Results Period Average Radiance Data Impact by Sensor All radiance data reduces the 12-hour forecast error AMSUA data from N18 and N19 have the largest and second largest impact respectively followed by CrIS, AIRS, AMSUA from N15, and SSMIS from F17 CrIS NPP CrIS NPP ATMS NPP ATMS NPP AIRS Aqua AIRS Aqua SSMIS F18 SSMIS F18 SSMIS F17 SSMIS F17 AMSUA Aqua AMSUA Aqua AMSUA N19 AMSUA N19 AMSUA N18 AMSUA N18 AMSUA N15 AMSUA N15 Larger Impact MHS N19 MHS N19 MHS N18 MHS N18 HIRS4 N19 HIRS4 N19
Observation Impact Results SSMIS Data thinned to reduced the effect of correlated observation error Channels whose weighting functions peak close to surface or above model top not used Some channels “blacklisted” Good forecast error reduction achieved by assimilating temperature channel data Moisture channel data impact is small but beneficial
Observation Impact Results ATMS * Data thinned to reduced the effect of correlated observation error Channels whose weighting functions peak close to surface or above model top not used Good forecast error reduction achieved by assimilating temperature channel data Moisture channel data impact is very small * Figure from NOAA/STAR
Observation Impact Results CrIS 399 channel subset of the data received by AFWA 84 channels assimilated Data thinned Largest Impact with subgroup of channel numbers less than 80
Observation Impact Results Non-Radiance Measurements Radiosonde data (SOUND) has the largest impact of the non-radiance observation types Surface observations over land (ADPSFC) have the next largest impact Aircraft (AIRCFT) data has the third largest impact followed closely by the combined impact from the COSMIC satellites Impact of winds derived by tracking features with geostationary satellites (SATWND) is relatively small COSMIC (1-6)
Observation Impact Results GPS Bending Angle Significant overall impact Most of impact is in the upper troposphere and low to mid stratosphere
Summary and Future Work • The GSI version of the observation impact assessment tool Forecast Sensitivity to Observations was used to determine the relative impact of various types of weather observations on 12-hour WRF model forecast accuracy over South West Asia • Radiance data accounted for nearly 75% of the total impact achieved through assimilating all observations • The assimilation of ATMS, CrIS, and SSMIS data was successful and acted to reduce the forecast error • Apply the FSO tool to more domains which are higher resolution ~15 KM