Download
1 / 24
240 likes | 263 Views
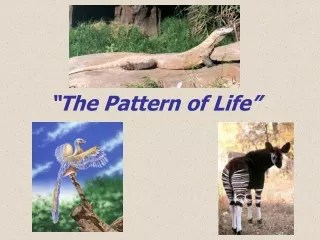
“The Pattern of Life”. The Morphological Distribution.

E N D
The Morphological Distribution Anatomical characteristics (morphology) of both the fossil & living organisms can be depicted by points on a multidimensional graph. We can simplistically demonstrate in a two-dimensional schematic diagram to observe some of the patterns that might emerge. These will illustrate the much more complex patterns found in the record of life.
The Limits on Variation Now if we consider just these two dimensions, we can observe that populations vary within certain limits prescribed by genetic information. These limits (represented by ellipses) become a “yardstick,” established by actual observations of ancestors and descendants in the field and in the lab. Even if all our populations do not contain organisms to fill such ellipses, each group (whether species, family etc.) might reasonably have varied similarly over time.
Potential Patterns Now there are multiple patterns that could conceivably emerge from an exercise like this (or the more sophisticated and realistic cladograms employed by taxonomists to classify different organisms). Consider just two: the data points plotting along some type of curve, and the data demonstrating gradual change uniting disparate groups with gaps no bigger than the experimental yardstick.
Models of Origins Now let us consider the patterns that might be predicted by different models of origins. This is more difficult to illustrate with a simple schematic diagram. But if we “zoom out” and let a single black point now represent an isolated population (akin to a species), we can convey some of the different patterns expected by the competing models of origins.
The Fixed Species Model Early Creationists believed that each species was specially created for its particular environment and that the basic morphology was rather rigidly fixed. Thus one should readily be able to segregate organisms into their various created types.
The Predicted Evolution Model Charles Darwin predicted that as more fossils were found, the gaps would be filled in and a clear pattern of ancestors and descendants would emerge. A pattern of life that would provide strong evidence of common descent could feature gradualism (lower right). But even the mere pattern of ancestors and descendants (lineages) along clear trajectories (with a void of organisms orthoganal) would suffice as solid evidence.
The Predicted Evolutionary Tree Gradual Evolution Definitive “Transitional Forms” Clear “Common Ancestors”
The Actual Pattern Rather than fixed species (as some early creationists once believed) or the clear phylogeny and gradual evolution (as the evolutionists predicted), the actual pattern of life encompasses tremendous potential for variation within populations and an overall structure of groups within groups (or “nested hierarchy”), such that groups are separated by large (vis-à-vis the “yardstick” of slide 4), systematic gaps.
The “Common Descent” Interpretation The darwinists have interpreted this nested hierarchy pattern as evidence for evolution, though the theory does not predict such a pattern. However, a more pressing problem is that the actual data are only on the twigs and leaves. Species lie off to the side of the alleged “tree” of descent and the huge gaps are not bridged by plausible intermediate forms. Evolutionists completely disagree amongst themselves about ancestors.
Common Descent Quote “The evolutionary trees that adorn our textbooks have data only at the tips and nodes of their branches; the rest is inference, however reasonable, not the evidence of fossils.”(Gould, Stephen J., “Evolution’s Erratic Pace,” Natural History, 1977, p. 14.)
Typical Evolutionary “Tree of Life” TypicalEvolution-ary “Tree of Life”
The “Intelligent Design” Interpretation Modern Creationists believe that each kind of organism was designed with a tremendous potential for genetic variation. This can make it difficult to readily discriminate kinds, particularly when only a few bones might remain as evidence. But this model readily fits the actual pattern with what might be called a “meadow” where each stalk identifies a distinct group of organisms (or holobaramin) whose ancestors were interfertile.
The Message in the Pattern of Life But why would an intelligent designer create organisms with a pattern of nested hierarchy? For a rigorous presentation of how the pattern of life defies naturalistic explanations and how it communicates the message of a single, powerful, intelligent Designer, see the book The Biotic Message in the Genesis Park Store. Discontinuity Systematics is an area of active research as creationists seek to use interfertility and genetic experiments to define holobaramin.