Download
1 / 24
250 likes | 396 Views
A mechanism for the orbital pacing of Eocene hyperthermals Dan Lunt, Andy Ridgwell, Appy Sluijs, Jim Zachos Stephen Hunter, Alan Haywood. Introduction AOGCM results and Eocene/PETM ocean circulation Hydrate modelling Conceptual model for hyperthermal orbital pacing. Orientation…

E N D
A mechanism for the orbital pacing of Eocene hyperthermalsDan Lunt, Andy Ridgwell, Appy Sluijs, Jim ZachosStephen Hunter, Alan Haywood • Introduction • AOGCM results and Eocene/PETM ocean circulation • Hydrate modelling • Conceptual model for hyperthermal orbital pacing
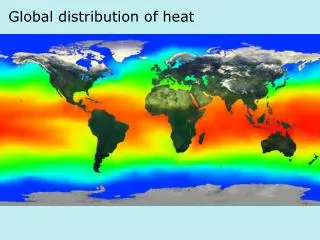
Orientation… Palaeocene-Eocene Thermal Maximum Zachos et al, Nature, 2008
Causes of PETM have been debated – implications for carbon input and therefore climate sensitivity Dunkley Jones et al, 2010
One hypothesis: release of methane hydrates due to enhanced warming: …and “data”: some evidence from ocean-only modelling. Nunes and Norris, 2006 Bice and Marotzke, 2004
So, what did we do? – Fully coupled HadCM3(L). (1) Palaeogeography Topography Vegetation
(2) CO2 1680ppmv = 6* 1120ppmv = 4* 560ppmv = 2* Zachos et al, Nature, 2008
Runs at 1,2,4,6 * pre-industrial CO2. ~3500 years Global mean temperature vs CO2 forcing
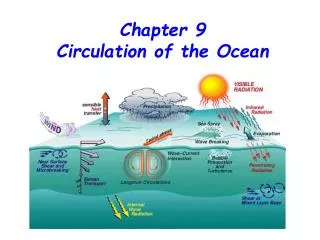
‘Kink’ in HadCM3 climate sensitivity Streamfunctions: 1*,2*,4*,6* Normalised 1km ocean Temperature, Eocene 2*-1*, 4*-1*, 6*-1*
Mixed Layer depth, 1* 2*, 4*, 6* DJF: JJA:
Implications for PETM: Bice and Marotzke, 2004
Conclusions (1) • Eocene model shows fairly linear surface temperature response to CO2, but… • Deep ocean warms non-linearly, associated with reduction in deep water formation and switch in ocean circulation. • Implications for hydrates: initial forcing (e.g. volcanic) could cause ‘run-away’ positive feedbacks. • Supported by other modelling work (Winguth et al, 2010) Lunt et al, Geology, 2010.
And orbital pacing…. See also Westerhold et al., Lourens et al “Hence, we suggest that the extreme seasonal contrast at both hemispheres during eccentricity maxima increased intermediate seawater temperatures, thereby triggering the release of oceanic methane hydrates.”
6 Additional simulations with orbital pertubations, 1000years in length: Maximum seasonality: obliquity=0.43 rad, eccentricity=0.054 Minimum seasonality: obliquity=0.38 rad, eccentricity=0
Mixed layer depth, JJA Minimum seasonality Maximum SH seasonality 1km Temperature difference, Minimum seasonality minus Maximum SH seasonality
Time-dependent sediment hydrate model of Davie and Buffett (2001). Simulates hydrate evolution, given a bottom-water temperature forcing, plus other (poorly constrained) variables. Here: depth = 1500m, at ‘bullseye’ of orbitally-induced temperature anomaly Forcing: Response: CH4 [kg/m2] Millions of years
Conceptual ‘threshold’ model for combined CO2 and orbital impacts on circulation, hydrate, and temperature, Informed by GCM and hydrate modelling
Conclusions (2) • GCM responds in a similar way to orbital forcing as to CO2 forcing. • Conceptual model, informed by GCM and hydrate model results, produces results qualitatively in agreement with data. • Therefore, we propose a possible mechanism for orbital pacing of hyperthermals, via hydrate destabilisation
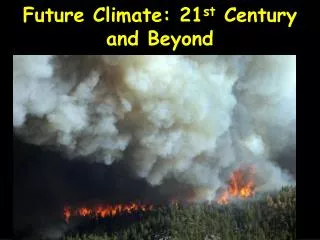
Warm Climates of the Past – a lesson for the future? 10 - 11 October 2011 The Royal Society, London Speakers include: Jim Hansen, Bette Otto Bliesner, Jeff Kiehl, Paul Valdes
Comparison with data: Temperature ANOMALIES, PETM – ‘backgound’ Eocene
Eocene Model Intercomparison Project (‘EoMIP’) results Lunt et al, Geology, 2010 Heinemann et al, Climate of the Past, 2009 Winguth et al, Journal of Climate, 2010 Huber et al, PPP, 2006 Roberts et al, EPSL, 2009 Panchuk et al, Geology, 2008
280 560 1120 2240 4480 ppmv What are the reasons for the differences between models…? And the differences between models and data…?