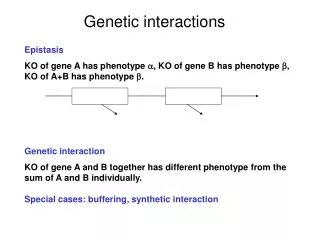
Genetic interactions
Genetic interactions. Wolfgang Huber EMBL Genome Biology Unit & EBI 23.9.2009. Complex traits. Do not follow Mendelian inheritance and result from multiple alleles Responsible alleles contribute different amounts to phenotype

Genetic interactions
E N D
Presentation Transcript
Genetic interactions • Wolfgang Huber • EMBL • Genome Biology Unit & EBI • 23.9.2009
Complex traits Do not follow Mendelian inheritance and result from multiple alleles Responsible alleles contribute different amounts to phenotype Alleles may be present in only a fraction of all individuals with the phenotype Need large sample sizes and high density marker maps to find alleles
The genetic basis of complex traits Currently ~400 variants that contribute to common traits and diseases are known Even when dozens of genes have been linked to a trait, both the individual and the cumulative effects are disappointingly small (<5%) Limitations to current genome-wide association studies: Common SNPs miss rare variants with potentially huge effects Common variants with low penetrance also missed Many structural variants go undetected because they do not alter SNP sequences Epistasis, where the effect of one variant cannot be found without knowing the other, confounds identification Picture emerges that complex traits are conditioned by multiple variants with different effect sizes and frequencies
Genetic architecture of complex traits: Largephenotypic effects and pervasive epistasisSinger et al. Science 2004, Shao et al. PNAS 2008 (J. Nadeau lab) • C57BL/6J A/J differ for many physiological, morphological, behavioral, immunological, and oncological traits, including models of birth defects and adult diseases in humans
CSS Panels • Chromosome substitution strains (CSS) panel: • Strain CSS-i carries both copies of chromosome i from donor strain, but all other chromosomes from the host strain are intact and homozygous. • Creation of C57BL/6J - A/J panel required more than 17,000 mice and 7 years. (With up-to-date selective breeding and genotyping, now estimated ~ 4 years.) host donor IIIIIIIIII IIIIIIIIII
Phenotyping of 90 different complex traits 41 traits significantly different between parentals average of 8 CSSs per trait average phenotypic effect per chromosome: 76% of the total!
Interactions Additive model for quantitative trait Y General model with interactions Xi : genotype at locus i bij : interaction effect of loci i, j bi : main effect of locus i
viability A B X viability A*B* wt A* B* B A A*B* wt A* B A Types of interactions positive (synergistic) interaction negative (buffering) interaction viability B* negative (suppressing) interaction A*B* wt A* B*
An example: sporulation efficiency in yeast BC187 YPS606 oak vineyard Sporulation efficiency: 99% 3.5% 374 recombinant segregants 5 linked loci linkage analysis Gehrke et al., Science 323 (2009)
Analytical series expansion Parameter fit (ANOVA) Gehrke et al., Science 323 (2009)
Two loci A and B with alleles A, A and B, B Equal and independent allele frequencies Quantitative trait Y average value of Y in Aindividuals = average value of Y in Aindividuals = 150 (similarly for B) Why association studies in outbred populations might fail to find important QTLs
Image processing ‘normalization’ Interaction modeling 96 Drosophila kinases and phosphatases Screening in 384-well microscopy plates Screening for interaction networks amongDrosophila kinases and phosphatasesT. Horn, T. Sandmann, M. Boutros (DKFZ) B. Fischer, E. Axelsson (EMBL) 192 reagents 192 reagents • Expressed in S2 cells (RNA-Seq) • Two independent RNAi designs • Knock-down validation (qPCR) Query 1 Query 2 • 96 plates (~37.000 wells) • 4 600 interactions • Readout (Hoechst nuclear staining) • Multi-parametric readout (nuclei number, size, total intensity)
Estimating genetic interactions Decomposition into main effects and interactions Pij = Wi + W’j + Wij by minimizing Density Z-score
The assay shows high reproducibility … between replicates … between independent designs Main effect 2 Main effect 2 Main effect 1 Main effect 1
Interaction estimates are reproducible between independent designs design 2 design 1
Interaction profiles cluster genes accordingto function Cluster of MAP kinase pathway members Drk Dsor1 Ras85D Pnt Csw Sos
Protein networks based on synthetic genetic interactions • Limited number of PP with many interactions, e.g. • puc • PP1- a96 • Expansion to larger network sizes, more complex phenotypes • Application to RNAi-drug interactions
Beyond loss of function • Many genetic techniques report loss- or gain of function of a particular allele of a gene • Variation in the human population is determined, to a significant extent, by allelic differences whose role can be more complex than that.
Reciprocal Hemizygosity Scanning (RHS) Haploid genome 1 Haploid genome 2 A tool for analyzing all allelic differences between two genomes in a single step using a hybrid strain With Lars Steinmetz, Julien Gagneur, Emilie Fritsch, Stefan Wilkening, Simon Anders
Fitness Profiling with Deletion Pools Steinmetz and Davis, Nature Reviews Genetics, 2004
Genetic variability between strains S288c ~ 80,000 SNPs Median distance between consecutive SNPs ~ 70bp SK1 Liti et al., Nature, 2009
Growth rate inheritance among segregants: YPD 768 segregants X … s = 1.96 gen./day Trait = growth rate Growth rate (gen/ day) Heritability H = 94% gen./day
YPD growth loci identified by RHS SK1 allele is beneficial (gen/day) S288c allele is beneficial Ribosome and partners: RPL12B, RPL21A, RPL23B, RPL35A, RPL6A, RPS24A, YNL247W Cytoskeleton assembly: MSS4, SLA2 Myosin motor: MYO2 Splicing factor: SLU7
Non-additive interactions among alleles S288c allele is beneficial SK1 allele is beneficial
drug-specific loci SK1 allele is beneficial S288c allele is beneficial (relative growth rate) Mitochondrial import: TIM17, ZIM17 (cant) Budding: BUD31 (cant) ATP synthase: FMC1 (LatA) Arginine synthesis: CPA1(LatA)
BUD31: drug-dependence pattern YPD Cantharidin 250 mM Deletion of: Deletion of:
Conclusion and future directions Genome-wide screen with RHS collection appears to work Identifies alleles that would have been difficult to identify by linkage In progress: Reconstruct deletions of candidates to obtain independent biological replicates Allele replacement into parental backgrounds
Thank you Simon Anders Elin Axelsson Richard Bourgon Bernd Fischer Audrey Kauffmann Gregoire Pau Robert Gentleman, F. Hahne, M. Morgan (FHCRC) Lars Steinmetz, J. Gagneur, Z. Xu, W. Wei (EMBL) Michael Boutros, F. Fuchs, D. Ingelfinger, T. Horn, T. Sandmann (DKFZ) Steffen Durinck (Illumina) All contributors to the R and Bioconductor projects
A combinatorial RNAi screenT. Horn, T. Sandmann, M. Boutros (DKFZ); E. Axelsson (EBI) X dsRNAs 384-well plate 384-well plate >3500 PP x PP (quadruplicates) PP x positive controls PP x negative controls PP alone Arrays of RNAi reagents