Download

1 / 30
300 likes | 436 Views
Estimating genetic interactions from combinatorial RNAi screens. IASC Yokohama 7 December 2008 Wolfgang Huber European Molecular Biology Laboratory European Bioinformatics Institute. Many genes are functionally uncharacterized. Homo sapiens 25,000 Drosophila 15,000 C. elegans 17,000

E N D
Estimating genetic interactions fromcombinatorial RNAi screens IASC Yokohama 7 December 2008 Wolfgang Huber European Molecular Biology Laboratory European Bioinformatics Institute
Many genes are functionally uncharacterized Homo sapiens 25,000 Drosophila 15,000 C. elegans 17,000 S. cerevisiae 6,000 } < 40-50% ~ 60% Genes Functional information In addition to protein-coding genes, there are 1000s of non-coding RNA and 100,000s of regulatory elements
Much of our genetic knowledge is from perturbation (loss or partial loss of function) phenotypes wild type knock-out
biological (sub)system I n p u t s O u t p u t s
Perturbation RNAi drug cDNA expression System cell-based assay insect embryo Phenotypic readout luminescene reader cytometry (distribution ofcell cycle states) microscopy
RNA inhibition (RNAi) A natural mechanism: on seeing a double stranded RNA, 'all' existing gene transcripts in the cell with the same sequence are destroyed - effectively shutting down this gene. This natural mechanism can be exploited for targeted gene knock down experiments. The evolutionary origins of RNAi are thought to lie in defense against viruses. He and Hannon, 2004
neg. controlIAP RNAi Kc167 S2R+ cells 72h post transfection RNAi to analyze loss of function of a specific gene - parallelized to whole genome Boutros & Ahringer, Nat Rev Genet 2008
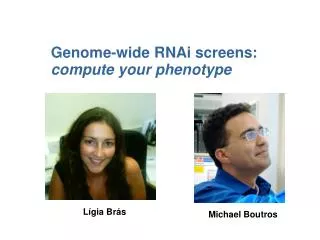
RNAi screening to generate quantitative perturbation profiles RNAi screen for modifiers of cell viability ...:replicate 2 quantitative "fitness" readout: replicate 1 Distinguish phenotypic changes of <15% siRNAs in 384-well assay plates RNAi in cultured cells by bathing or transfection 2-5 days incubation Phenotypic readout >40,000 measurements per day
cellHTS2 an R package providing data management and complete workflow for analysing a cell-based assay experiment www.bioconductor.org
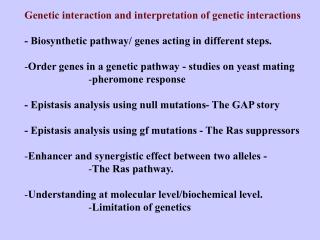
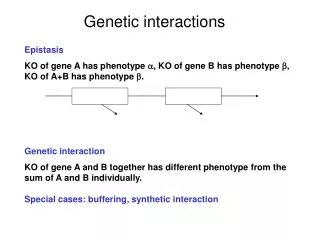
What is a genetic interaction? Conceptually: when the action of one gene is modified by one or several other genes direct • protein – protein interaction • protein – DNA interaction indirect • gene products act in the same pathway • redundancy (buffering) • proteins • pathways • ... Empirically: when the phenotype of a combination of losses (or gains) of function is different from what is expected from individual phenotypes.
Why is it interesting? 1. Genes that interact may be related 2. Genes that interact similarly with everyone else may have similar functions Yeh et al. found that drugs with similar mechanism showed the same interactions with other drugsNature Genetics 38 (2006) Tong et al. found that interacting genes tended to share GO annotationsScience 303 (2004)
Genetic interactions phenotype Gene A Gene B positive (synergistic) interaction phenotype wt A B A+B negative (antagonistic) interaction A phenotype B phenotype wt A B A+B B buffering interaction phenotype A wt A B A+B phenotype
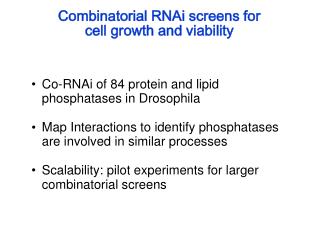
A cell-based combinatorial RNAi co-knock-down screen Set of 84 phosphatases • they dephosphorylate other molecules (opposite function of kinases) • activate or deactivate enzymes • involved in many signal transduction pathways • not well understood Test all vs all for interactions: interactions might reveal which phosphatases are involved in similar processes Scalability: pilot experiment for a genome-wide combinatorial screen Joint work with M. Boutros, T. Horn (DKFZ) and R. Gentleman (Seattle)
Experimental setup: Criss-cross design 4 "column plates" (4x21=84) 6 "row plates" (6x14=84) column j row i X dsRNAs 384-well plate 384-well plate well i:j Measure >3500 pair wise phospatase-phosphatase interactions (4 replicates each) 84 interactions of phosphatases with positive controls 84 ... with negative controls 24 "mix plates" (4x6)
Quality assessmentreciprocity of pairwise interactions: Pi:Pj vs Pj:Pi Bad Good Kc167 SL2
Reproducibility Three replicate experiments (1,2,3) with 2 directions (Pi:Pj, Pj:Pi) each (a,b)
Estimating interaction effects Yijk data: i,j{1,...,84}(genes), k{1,...,3} (replicates) Pi main effect of gene i Pij interaction i:j There are three regions in data space from which we could estimate the single gene effects Pi 1.)j = 0, negative control (assuming P0 = 0, Pi0 = Pi ) 2.) j = i (assuming Pii = Pi ) 3.) set aside 1.+2., minimize ||||. Attractive option: penalize Pij 0 Differences between 1, 2 and 3 can be used as diagnostic for experiment quality / model fit.
Estimating interaction effects viability hits synergistic interactions antagonistic interactions
In a previous pilot experiment: unexpected dosage dependence
Related phosphatases show similar interaction profiles cluster of lipid phosphatases (CG11437, CG11438, wun) interact with JNK signaling synergistic antagonistic interactions
Graph(ical) representation of sparse interaction matrix Limited number of PP with many interactions, e.g. puc PP1- a96
Discussion Importance of data quality control and diagnostics for checking modeling assumptions Linear modeling approach seems natural, but: on which scale? (measured fluorescence vs log scale) caveat saturation and background signal Regularisation to achieve sparsity seems desirable
Next steps Expansion to larger gene sets (genome-wide instead of 84): what is the most economic experimental design? More complex phenotypes (rather than 'viability'): automated quantification of cytometry or microscopy data Application to RNAi-drug interactions
Thank you DKFZ Michael Boutros Florian Fuchs Christoph Budjan Thomas Horn David Zhang FHCRC Seattle Robert Gentleman Florian Hahne Martin Morgan The contributors to the R and Bioconductor projects Simon Anders Elin Axelsson Richard Bourgon Rémy Clement Kristen Feher Bernd Fischer Audrey Kauffmann Daniel Murell Gregoire Pau Ramona Schmid Oleg Sklyar Jörn Tödling
What is a phenotype: it all depends on the assay Any cellular process can be probed. - (de-)activation of a signalling pathway - cell differentiation - changes in the cell cycle dynamics - morphological changes - activation of apoptosis Similarly, for organisms (e.g. fly embryos, worms) Phenotypes can be registered at various levels of detail - yes/no alternative - single quantitative variable - tuple of quantitative variables - image - time course
Rescue from positive control (DIAP1) • DIAP, Drosophila Inhibitor of Apoptosis • commonly used as positive control • co-depletion with P71 shows rescue phenotype • reproducible in different cell lines S2 A*B* wt A* B* negative (suppressing) interaction
Normalization: Plate effects k-th well i-th plate Percent of control Normalized percent inhibition z-score
Zhang JH, Chung TD, Oldenburg KR, "A Simple Statistical Parameter for Use in Evaluation and Validation of High Throughput Screening Assays." J Biomol Screen.1999;4(2):67-73. NB: would be more efficient