Download
1 / 28
280 likes | 433 Views
Joint analysis of genetic and physical interactions in S. cerevisiae. Igor Ulitsky Ron Shamir lab School of Computer Science Tel Aviv University. Genetic interactions (GI). “Aggravating” interactions The observed phenotype is worse than what we would “expect”

E N D
Joint analysis of genetic and physical interactions in S. cerevisiae Igor Ulitsky Ron Shamir lab School of Computer Science Tel Aviv University
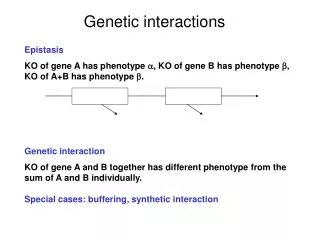
Genetic interactions (GI) • “Aggravating” interactions • The observed phenotype is worse than what we would “expect” • Synthetic lethality: joint deletion of two nonessential genes lethal phenotype • Synthetic sickness:joint deletion of two nonessential genes slow growth
GI availability • Systematically mapped by SGA and dSLAM • Available for ≈200 gene queries and ≈4,500 targets in S. cerevisiae • GI network: 13,632 interactions, 2,682 genes
Physical interactions (PI) • Protein-protein interactions • Y2H • TAP • Protein-DNA interactions • Chip2 experiments • PI network: 68,172 interactions, 6,184 proteins
GI Analysis Spectra • Genetically interacting homologs tend to exhibit “compensation” on the expression level • R. Kafri et al. 2005 • Genetically interacting proteins frequently have a similar fold • O. Dror et al. 2007 • Genetic interactions can be used to delineate regulatory pathways • R.P. Onge et al. 2007
Joint analysis of GI and PI • Motivation: • Identifying pathways • Connect pathways with phenotypes • Understand system features (robustness, essentiality…) • Initial analysis: • Proteins close in the GI network slightly more likely to physically interact (Tong et al., 2004) • PI hubs likely to be GI hubs (Ozier et al., 2003)
GI PI BPMs • Kelley and Ideker, 2005: modeling “explanations” for GIs Between-pathway model Within-pathway model
Kelley & Ideker conclusions • 40% of the GIs can be explained by physical models • Between-pathway models explain x 3.5 times more GIs than within-pathway models • Models capable of predicting protein functions
BPM rationale • Between pathway models suggest redundancy • Alternative paths • Independent KOs little effect • Joint KOs in both severe effect Viable phenotype Lethal phenotype Viable phenotype
BPM Hunting • Look for pairs of pathways with GI evidence for buffering • A pathway – a connected subnetwork in of PIs • Model scoring based on the density of GIs • Log-likelihood scores accounting for GI degrees
Algorithmics • High-scoring seeds • Finding heavy bicliques with connectivity constraints • Seed optimization • Greedy search maintaining connectivity • Significance filtering
Adding “pivot proteins” to BPMs Pathway bifurcation Redundant sub-complexes
Pivot proteins • Physically connected to both pathways in the BPM • Connection significant given the general network degrees
Analysis flow 13,632 genetic interactions 68,172 physical interactions • Essentiality • Phenotypes • Protein Abundance • Codon adaptation index • mRNA half-life • Phoshorylation BPM analysis 140 models Pivot extraction 124 pivot proteins in 40 models Physiological characteristics
BPMs as functional modules • Functional enrichment analysis (TANGO): • 71.4% enriched for GO “biological process” • 69.3% enriched for GO“cellular compartment” • 46.3% of known complexes enriched in at least one BPM
Pivot proteins are essential • Q: Are proteins active in multiple partially redundant pathways more essential? • 72/124 (58%) pivots essential (p=1.42·10-23) • Enrichment is not explained by node degrees (p<10-5) • Essential pivots closer in function to their BPMs than nonessential pivots • Pivots significantly retained during evolution (p=9.79·10-9)
SWR1 Ino80 SWR1/Ino80 Example Pivots
Nuclear pore SAGA SAGA/Nuclear pore example Pivots
Physiological properties of BPMs • Proteins studied: • 850 proteins within BPMs • 120 pivot proteins • Focus on • mRNA half life • # of phosphorylation sites
BPMs are strongly regulated • Genes within BPMs • Shorter mRNA half-life (p=1.9·10-9) • More phosphorylation sites (p=6.3·10-9) • Both properties may represent regulation • Redundant pathways Strict regulation ? • Enrichments not explained by degrees, essentiality, any enriched function • mRNA half-life : experimental data, phosphosites : predicted • Properties generally not correlated
Next generation – quantitative GIs • Data on quantitative genetic interactions scores is becoming available • These include also alleviating interactions
Alleviating interactions • The observed phenotype is better than what we would “expect” • “Expect” – multiplicative model: • Mutation A – 80% fitness is retained • Mutation B – 60% fitness is retained • A & B – 48% fitness is retained • The first deletion ruins the functionally of the pathway, and the second one does not have an effect • An alleviating interaction is a sign of participation in the same pathway
Extracting BPMs from quantitative data • Probabilistic model for the aggravating/alleviating interaction scores • Detection of pathways and buffering using quantitative data
Extracting BPMs from quantitative data • Next challenge: simultaneously extraction of multiple pathways • The output includes: • Pathway boundaries • Pairs of buffering pathways
Summary • Computational analysis outlines pathways and buffering pathway pairs - BPMs • BPM pathways tend to be strictly regulated • BPM pivots correspond to essential multifunctional proteins • Quantitative GIs carry the promise of a reacher analysis