Download
1 / 33
330 likes | 472 Views
Imaging-based phenotyping and genetic interactions. EMBL. Wolfgang Huber Bernd Fischer, Thomas Sandmann, Thomas Horn, Maximilian Billmann, Michael Boutros. Genetic interactions.

E N D
Imaging-based phenotyping and genetic interactions EMBL Wolfgang Huber Bernd Fischer, Thomas Sandmann, Thomas Horn, Maximilian Billmann, Michael Boutros
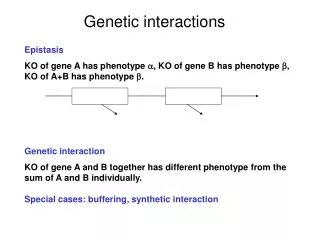
Genetic interactions Effect (phenotype) of a combination of genetic variants is different from what is expected from the individual effects ΔA ΔB 0 gene-gene gene-environment environment-environment higher order
Genetic interactions Human genetics: GWAS produced many loci, but much phenotypic variance remains unexplained - due to genetic interactions Model system genetics: interactions between naturally occuring genetic variants determine many physiological phenotypes
Genetic interactions cannot be tackled from observational data alone - need interventional data from experimental model systems Association study: main effects ~106 loci sample size ~5,000 pairwise interactions ~1012 pairs sample size ~450,000 (Zuk et al. 2012)
Reverse genetics from genes to phenotypes → deletion libraries → high-throughput RNAi • Forward genetics • from phenotypes to genes • → genome-wide association studies • → cancer genome sequencing
Yeast has been leading the way yeast: pairwise interactions of 1712 x ~3100 gene knockouts for ‘viability’
What is RNAi? • Source: Wikipedia
High-throughput RNAi and automated cellular phenotyping RNAi or drug library Feature extraction Segmentation g.x g.y g.s g.p g.pdm [1,] 123.1391 3.288660 194 67 9.241719 [2,] 206.7460 9.442248 961 153 20.513190 [3,] 502.9589 7.616438 219 60 8.286918 [4,] 20.1919 22.358418 1568 157 22.219461 [5,] 344.7959 45.501992 2259 233 35.158966 [6,] 188.2611 50.451863 2711 249 28.732680 [7,] 269.7996 46.404036 2131 180 26.419631 [8,] 106.6127 58.364243 1348 143 21.662879 [9,] 218.5582 77.299007 1913 215 25.724580 [10,] 19.1766 81.840147 1908 209 26.303760 [11,] 6.3558 62.017647 340 68 10.314127 [12,] 58.9873 86.034128 2139 214 27.463158 [13,] 245.1087 94.387405 1048 123 18.280901 [14,] 411.2741 109.198678 2572 225 28.660816 [15,] 167.8151 107.966014 1942 160 24.671533 [16,] 281.7084 121.609892 2871 209 31.577270 Quantitative cell and organelle features multivariate phenotypic landscape Michael Boutros Boutros, Bras, Huber, Genome Biol. 2006 Fuchs, Pau et al. Mol. Sys. Biol. 2010 Pau, Fuchs et al. Bioinf. 2010 Neumann et al. Nature 2010 Kuttenkeuler et al. J. Innate Imm. 2010 Axelsson et al. BMC Bioinf. 2011 Horn et al. Nature Methods 2011 Gregoire Pau
Genetic interactions for multiple phenotypes 384-well plates, microscopy readout with 3 channels (DAPI, phospho-His3, aTubulin) Fly: 1367 x 72 genes (Human: genome x 16 alleles) neg. ctrl Rho1 dsRNA Dynein light chain dsRNA number of cells area mitotic index shape variances 01/23/11 Bernd Fischer Horn*, Sandmann*, Fischer*, ..., Huber, Boutros. Nature Methods 2011 16
Selection of target genes - Coverage by ≥ 5 reads in an RNA-seq data set- Orthologous gene in H. sapiens, M. musculus, C. elegans or S. cerevisiae
Multiple phenotypes are observed z-score z-score z-score z-score
Genetic interactions in multiple phenotypes Genetic interaction: effect of combination is different from what is expected from individual effects
3D data cube 1293 target genes x 2 dsRNA x 72 query genes x 2 dsRNA x 21 features Thomas Horn Thomas Sandmann
Genetic interaction map clustering of genetic interaction profilesred: ribosome biogenesisgreen: kinetochoreblue: centrosome
Co-complex score members of the same protein complexes are enriched for high correlation of interaction profiles=> learn co-complexity score (naive Bayes)
Co-complexity score matrix Chaperonin-containing T-complex anaphase-promoting complex γ-tubulin ring complex DNA−directed RNA polymerase II core complex 26S proteasome
Multi-phenotype interactions give nested & high-resolution views on biological modules Interaction networks based on cell number Interaction networks based on all phenotypes
Cancer mutations GI-map Glio- blastoma Medullo- blastoma Breast cancer Prostate carcinoma Colon carcinoma
Clusters of cancer mutations MTOR, TRRAP: regulation and recruitment of histone acetyltransferases (HATs) to chromatin ARID1A and SMARCA4/2 require histone acetylation for prolonged binding to promoters MLL2 and ASH1L are H3K4tri-methyltransferases BRD1 binds to tri-methylated H3K4
Conclusion and outlook • High throughput RNAi in metazoan cells works • A scalable way to dissect physical and functional modules at mutltiple levels of resolution / hierarchy • Could be useful for annotating rare genetic variants of low penetrance
Bernd Fischer Thomas Sandmann Thomas Horn Maximilian Billmann Michael Boutros Simon Anders Joseph Barry Julian Gehring Felix Klein Malgorzata Oles Aleksandra Pekowska Paul-Theodor Pyl Alejandro Reyes Collaborations Lars Steinmetz (EMBL) Robert Gentleman (Genentech) Jan Ellenberg Martin Morgan (FHCRC) Christof von Kalle (NCT) Paul Bertone Jan Korbel Anne-Claude Gavin Michael Knop (Uni HD) Alvis Brazma (EBI) Magnus Rattray (Manchester)
The transient and quantitative nature of RNAi induced phenotypes log2(rel. cell number) Ras85D (ng) drk (ng) • reagent concentration (RNAi, drug) • (relative) timing of reagent applications and readout Interaction score positive (alleviating) none negative (aggravating) 7/11 01/23/11 Thomas Sandmann Horn*, Sandmann*, Fischer*, ..., Huber, Boutros. Nature Methods 2011 16
Number of interactions 1% FDR pos. and neg. interactions per feature fraction of gene pairs that interact fraction of gene pairs that interact cumulative over features 21 non-redundant features
Quality control of dsRNA designs detection of possible off-target effects:2 independent dsRNA designs per genequality criterium:cor. of multi-phenotype interaction profile between designs1293 genes passed QC
Quality control of features Quality criterium: Correlation of interaction profiles between replicatesand number missing values162 features passed QC correlation features
21 non-redundant features Selection procedure:- Fit a linear modelfor each feature as a function of the previously selected features- Select the feature with highest correlation of residuals between replicates- Stop criterium:equal proportion of pos. and neg. residual correlations
Reproducibility between batches The screen is performed in 12 batchesWe got high reproducibility between batches
Which kind of information • Classifier (shrinkage discriminant analysis) trained for • 3414 gene sets 252 gene sets classified with precision 50% at recall 50% fraction of gene sets data sources
Chaperonin mediated protein folding Spindle assembly checkpoint Specific small complexes: dynactin cohesin prefoldin condensin ubiquitin ligase High-content phenotyping and combinational perturbations: is it worth the effort? precision at recall 0.5 Classification performance on 3414 gene sets (SLDA): number of good classifiers high-content + combinatorial high-content + single RNAi low-content (viability) + combinatorial low-content + combinatorial high-content + combinatorial high-content + single RNAi 16
Definition, a bit more formally: • ΔΦij= ΔΦi+ ΔΦj+ Gij • we want Gij to be sparse • choice of scale for Φ (e.g. logarithm) • Φ can be multivariate (e.g. imaging, omics, time courses)