1 / 3

EU – Korea Trade in Services – Export (€ - Billions)

«  The voice of the European Service Industries for International Trade Negotiations  in Services  ». EU – Korea Trade in Services – Export (€ - Billions). +2.9 Bio € in 5 years i.e. + 67%. EU-Korea Trade in Services – Net Surplus. EU Trade in Services with Korea – Net Surplus

Download Presentation

EU – Korea Trade in Services – Export (€ - Billions)

An Image/Link below is provided (as is) to download presentation Download Policy: Content on the Website is provided to you AS IS for your information and personal use and may not be sold / licensed / shared on other websites without getting consent from its author. Content is provided to you AS IS for your information and personal use only. Download presentation by click this link. While downloading, if for some reason you are not able to download a presentation, the publisher may have deleted the file from their server. During download, if you can't get a presentation, the file might be deleted by the publisher.

E N D

Presentation Transcript


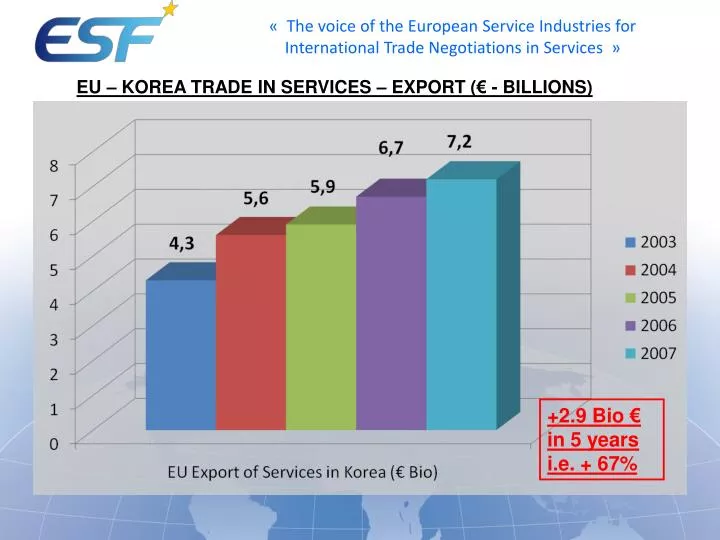
  1. «  The voice of the European Service Industries for International Trade Negotiations in Services » EU – Korea Trade in Services – Export (€ - Billions) +2.9 Bio € in 5 years i.e. + 67%

  2. EU-Korea Trade in Services – Net Surplus

  3. EU Trade in Services withKorea – Net Surplus Future Scenarios (€ Billions) NB: 3.2 Bio € was the surplus in 2007 (Eurostat)

More Related