Download
1 / 27
270 likes | 437 Views
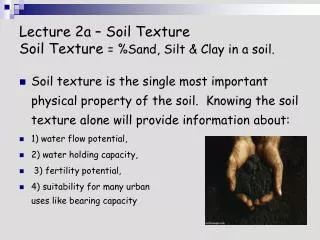
Modelling for the Soil Thematic Strategy: Assessing Erosion Control Measures. Erwin Schmid BOKU / IIASA w orkshop at JRC in Ispra, Italy 11 th - 12 th April 2005. Outline:. 6 Fields from the Kocin Farm (SK) Soil and Crop Management Information APEX model

E N D
Modelling for the Soil Thematic Strategy:Assessing Erosion Control Measures Erwin Schmid BOKU / IIASA workshop at JRC in Ispra, Italy 11th-12th April 2005
Outline: • 6 Fields from the Kocin Farm (SK) • Soil and Crop Management Information • APEX model • List of Alternative Management Practices to Control Water Erosion • Preliminary Model Results • Discussion
Field 16527: size: 50.4 haØ slope: 6.35 % Field 16528: size: 121.7 haØ slope: 2.78 % Field 16529: size: 30.2 haØ slope: 4.48 % Field 16553: size: 41.1 haØ slope: 2.11 % Field 16555: size: 78.5 haØ slope: 3.54 % Field 16556: size: 22.9 haØ slope: 2.57 % 6 Fields from the Kocin Farm (SK) Ø rainfall/yr: 540 mmelevation: 251 m
Crop Management Legend:
Agricultural Policy Environmental eXtender model optional 7 Water Erosion equations 1. MUST theoretical 2. AOF Onstad-Foster 3. USLE Universial Soil Loss Equation 4. MUSS Small Watershed MUSLE 5. MUSL Modified USLE 6. MUSI MUSLE with input parameters 7. RUSLE USLE for steep slopes>20% i.e. on a daily time step Management i.e.:- Buffer Strips- Grassed Waterways- Terraces
# # # # # # # # # # # LAND USE SOILS OUTLET DEM SUB-BASINS APEXModel MANAGEMENT WEATHER
List of Alternative Management Practicesto Control Water Erosion 1 conventional tillage (i.e. moldboard plough) - reference situation 2 contouring 3 reduced tillage (i.e. shallow disk plough) 4 minimum tillage (except for root crops, e.g. sugar beets) 5 winter cover crops
List of Alternative Management Practicesto Control Water Erosion 6 grassed waterways (10% of field; 50m width) 7 buffer strips (2% of field; 10m width) 8 terraces (i.e. permanent crops, e.g., vineyards) 9 comb. of management measures (1); e.g., contouring, disk plough & grassed waterway 10 comb. of management measures (2)
Water Balance conventional tillage 10 year averages: precipitation: 560 mm (450 - 680 mm) runoff: 36 mm (0 - 95 mm) subsurface flow: <1 mm percolation: 17 mm (0 - 118 mm)
Sediment Transport conventional tillage 10 year average using MUST: sediment yield:11.4 t/ha (0 - 54 t/ha)
Carbon in Soil Profile conventional tillage
Nitrogen Transport conventional tillage Nitrogen in kg/ha/y sediment: 8.0 (0 - 28.5) runoff: 0.9 (0 - 5.8) subsurface flow: <0.1 percolation: 1.0 (0 - 8.0)
Crop Yields conventional tillage
Impact Assessment of Alternative Management Practices for Field # 16527
Change of org. Carbon in Soil Profile after 10 years of simulation
Total Crop Production relative to Conventional Tillage (1) Note: Total production is the sum of dry matter yields of all crops in the crop rotation times field area. Reduced field area in (6), (7), and (9) due to waterways (-10%) and buffer strips (-2%).
Impact Assessment of Alternative Management Practices for all 6 Fields
Model Output Presentation with Output Response Functions Regression Model (OLS) using Dummy Variables where M2,..., M10 are alternative management practices that are represented by dummy variables (0,1)
Average Crop Yields (t/ha) Note: Average dry matter yields per hectare. Reduced field areas in (6), (7), and (9) due to waterways (-10%) and buffer strips (-2%).
Discussion • selection of representative plots across EU25 (project by end of July) • list of alternative management practices • time length of simulation (short, medium, long-run impacts) • crucial input information (field size, slopes, crop management i.e., fertilization, irrigation, tillage, etc.) • grassed waterway and buffer strip design • environmental and economic impacts • model output presentation: surface response functions