Download
1 / 19
190 likes | 403 Views
Monte Carlo model and spectral measurements of a computed tomography x-ray tube. Magdalena Bazalova Frank Verhaegen. Overview. Motivation Diagnostic x-ray beam production Monte Carlo (MC) simulations Spectral measurement in computed tomography (CT) geometry

E N D
Monte Carlo model and spectral measurements of a computed tomography x-ray tube Magdalena Bazalova Frank Verhaegen
Overview • Motivation • Diagnostic x-ray beam production • Monte Carlo (MC) simulations • Spectral measurement • in computed tomography (CT) geometry • experimental setup and Compton scatter • detector • Corrections of measured spectra • Results: Comparison of MC simulated spectra with measured spectra • Conclusions
Motivation • It is very difficult to assess patient dose from CT imaging and mostly approximative methods are used. • A Monte Carlo model of the x-ray tube of a CT scanner in combination with patient CT images will allow for an accurate estimate of CT dose. • However, the MC model has to be accurate in order to calculate the dose accurately. • To developed and validate (using spectral measurements) a MC model of a Philips PQ5000 CT simulator x-ray tube.
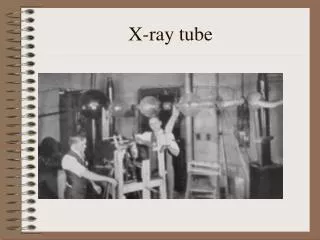
X-ray beam production tungsten target
Monte Carlo model of the PQ5000 x-ray tube • using the BEAM code and manufacturer’s specifications of the x-ray tube • anode material: W • anode angle: 7° • tube voltage: 100-140 kVp • additional filter: 9 mm Al
Spectral measurements of diagnostic x-rays • Not trivial due to the high photon flux causing pile-up in the detector of choice. • Can be solved by using very small collimators and/or increasing the x-ray source to detector distance; the alignment is then detrimental. • Not applicable for CT geometry and our detector, therefore, the x-ray flux has to be reduced in another way.
Problems of spectral measurements in CT geometry a few meters 80 cm • Attenuation? • Scatter!
Compton scatter- scatterer material • interaction of a photon of energy hν with a loosely bound orbital electron of an absorber
Scatterer material Solid line: Z=6 Dashed line: Z=50
Measurements of x-ray spectra: CdTe detector • 3×3×1 mm3 CdTe crystal (ZCd=48, ZTe=52) • Pt and In contacts
Spectrum corrections-detector response 2 mm 1 mm 3 mm 3 mm
Comparison of MC simulations and spectral measurements filtering kVp
Conclusions • An accurate Monte Carlo model of the PQ5000 CT simulator x-ray was developed. • The model was validated with spectral measurements using a CdTe detector in a Compton scattering setup. • A very good agreement between the MC simulated and measured spectra for the extreme tube voltages with and without an additional 9 mm thick aluminum filter was found. • The MC model can be used for CT dose calculation.
Acknowledgements • Robin van Gils • Wamied Abdel-Rahman • Derek Liu • Slobodan Devic • Jan Seuntjens • Joe Larkin • Medical Physics Unit staff and students • NSERC