Download
1 / 37
370 likes | 520 Views
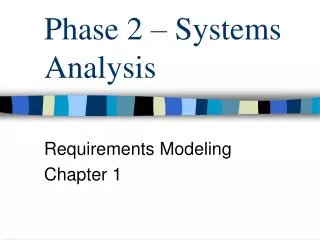
Phase diagrams for melting in the Earth (101): thermodynamic fundamentals Jan Matas Université de Lyon Ecole normale supérieure de Lyon, CNRS CIDER 2010. Labrosse et al. 2007. Jie Li (CIDER 2010). Metling in the Earth. Continental Crust. Ocean. Mid- ocean Ridge. Base of lithosphere.

E N D
Phase diagrams for melting in the Earth (101): thermodynamic fundamentals Jan Matas Université de Lyon Ecole normale supérieure de Lyon, CNRS CIDER 2010
Labrosse et al. 2007 Jie Li (CIDER 2010) Metling in the Earth Continental Crust Ocean Mid- ocean Ridge Base of lithosphere Oceanic Crust Plume Mantle Basal magma ocean Outer Core solidification (cf Jie Li) Inner core
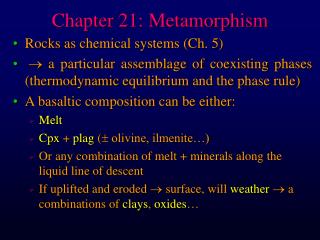
Natural samples: e.g. peridotite Pyroxene (Ca,Mg,Fe)(Mg,Fe,Al)(Al,Si)2O6 Olivine (Mg,Fe)2SiO4 Garnet (Ca,Mg,Fe)3(Mg,Fe,Al,Si)2(Al,Si)3O12
Natural samples: e.g. pallasite metallic alloy (Fe, Ni, Si, S, ...) olivine (Mg,Fe)2SiO4
Natural samples • - global composition: • Mg, Fe, Al, Ca, Si, Ni, S, O, ... • macro-scale: • assemblage of grains (each grain is a mineral) • micro-scale: • each grain = (solid) solution • a thermodynamic description requires • end-members • E.g.: (Mgx,Fey)2SiO4 = xMg2SiO4 + yFe2SiO4
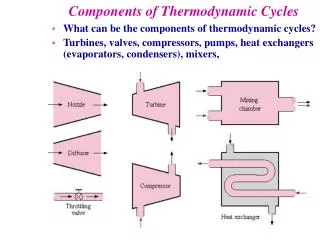
1600 1 atm = 0.1 MPa 1900 1 atm = 0.1 MPa 1800 1500 LIQUID liquidus solidus 1700 liquidus Temperature (oC) LIQUID “forbidden zone” Temperature (oC) L3 T3 1600 S3 X3 1400 x3 T3 X2 L3 1500 S3 L2 liquidus T2 S2 X1 1400 x2 L1 S1 L2 T1 T2 S2 L1 1300 x1 S1 solidus 1300 T1 S1 OLIVINE Eutectic 1200 X0 1200 Anorthite + Diopside 1100 Mg2SiO4 Fe2SiO4 Wt. % Fayalite X0 1100 Anorthite CaAl2Si2O8 Diopside CaMgSi2O6 X (Wt. %) Two diagrams, same thermodynamics Loop diagram Eutectic diagram cf … Cin-Ty Lee
Liquid Temperature L+S L+S Solid Solid Composition A1 A1 A2 A1 Rabbit diagram
Ideal mixing G* m0B m0A mB mA xB
A1 T T P1 P2 P3 X2 X1 X3 P P
T liquid X1 T X2 liquid s+l solid P T solid liquid P X3 P solid
Non-ideal mixing G*mix+G*ex W positive W negative
Non-ideal mixture G* m0B inflection point inflection point m0A
mB1 =mB2 mA1 =mA2 xB1 xB2 Non-ideal mixture G* inflection point inflection point
Non-ideal mixture G* m0B inflection point inflection point m0A T xB
Single mixture (AxB1-x ) Temperature TC two coexisting phases (Ax1B1-x1 ) et (Ax2B1-x2 ) instable stable instable x2 x1 x B Composition A1 A2 A
A1 A1 A’ B’ B1 B2 Liquid L+S Temperature Solid Composition A1 A1 A2 A1 A B
A1 A1 A’ B’ B1 B2 Liquid L+S Temperature Solid Composition A1 A1 A2 A1 A B
A1 A1 A’ B’ B1 B2 Liquid Temperature L+S Azeotropic minimum L+S Solid Solid Composition A1 A1 A2 A1 A B
A1 A1 A’ B’ B1 B2 Liquid Temperature L+S L+S Solid Solid Composition A1 A1 A2 A1 A B
A1 A1 A’ B’ B1 B2 Liquid Temperature L+S L+S E Solid Composition A1 A1 A2 A1 A B
Peritectic (Opx -> Cpx) Azeotropic minimu solidus