Download
1 / 24
240 likes | 498 Views
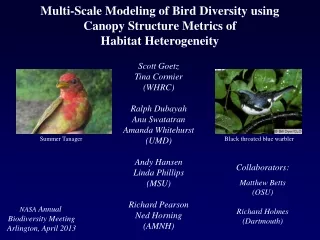
Multi-Scale Modeling of Bird Diversity using Canopy Structure Metrics of Habitat Heterogeneity. Scott Goetz Mindy Sun (WHRC) Ralph Dubayah Anu Swatatran Amanda Whitehurst (UMD) Andy Hansen Linda Phillips (MSU) Richard Pearson Ned Horning (AMNH). Magnolia warbler.

E N D
Multi-Scale Modeling of Bird Diversity using Canopy Structure Metrics ofHabitat Heterogeneity Scott Goetz Mindy Sun (WHRC) Ralph Dubayah Anu Swatatran Amanda Whitehurst (UMD) Andy Hansen Linda Phillips (MSU) Richard Pearson Ned Horning (AMNH) Magnolia warbler Black throated blue warbler Collaborators: Matthew Betts (OSU) Richard Holmes (Dartmouth) NASA Annual Biodiversity Meeting Seattle, April 2012
Objectives / Research Questions (1) How can patterns of ecosystem structure be observed and modeled at regional to continental scales? (2) What is the influence of satellite measurements of canopy structure on bird diversity (extent, richness and abundance)? (3) What are the relationships between bird diversity, vegetation structure and ecosystem productivity at regional to continental-scales? ~ Summer Tanager. Photo by Scott Somershoe, USGS.
Synergistic use of lidar, moderate to high resolution optical & SAR.. Hubbard Brook Experimental Forest What is the influence of satellite measurements of canopy structure on bird diversity (extent, richness and abundance) and habitat use (prevalence)? We made use of a unique bird observation data set across 371 sites at HBEF collected over 10+ years (1999-2009) 0 5 10 15 20 25 >30 m LVIS RH100 DRL Canopy Height 0 5 10 15 20 25 >30 m UAVSAR Landsat NDVI difference 0 0.6
Single versus multi-sensor predictions of the Bird Species Richness % variance explained Hubbard Brook Experimental Forest Swatatran, Dubayah, Goetz, et al. (2012 PlosOne)
Species habitat use varies with cover across a range of heights Ovenbird more prevalent in upper canopy but also near surface (ground gleaner) Yellow-rumped warbler more prevalent in lower canopy
Predictions of Species Abundance at HBEFBoosted Regression Tree Hurdle Model Hurdle modeling approach links a presence-absence model with an abundance model to address the issue of inflated zero counts - predictions can be interpreted as being abundance given suitable habitat (after Strubbe et al., 2010) Following Goetz et al. 2010 and Swatantran et al. 2012
Boosted Regression Tree Hurdle Model Predictions of Species Abundance at HBEF Good prediction… Reasonable prediction… Poor prediction… Black-throated blue warbler, r2=0.497 Brown Creeper, r2=0.049 Magnolia Warbler, r2=0.756 Mean r2 for 16 species = 0.381, Max = 0.756, Min = 0.039.
Boosted Regression Tree Hurdle Model Predictions of Species Abundance at HBEF
What are the relationships between bird diversity, vegetation structure and ecosystem productivity at regional to continental-scales? National Scale Predictors of Bird Diversity Patterns • Physical Environment: climate and topography • Vegetation Properties: canopy density / percent cover, functional groups, biomass • Vegetation Productivity: NPP, GPP (MODIS) • Vegetation Structure: GLAS metrics
GLAS shots within Breeding Bird Survey (BBS) routes At least 10
Robust Predictions of Bird Species RichnessForest Birds predicted well even in high Canopy Cover & Productivity areas All Forest Birds Explained Variance = 84% Cross-validated with 10% reserved BBS routes All 730 routes High Productivity Explained = 68% High Canopy Cover Explained = 63% High Canopy Cover routes (259) High productivity routes (389)
National Scale Predictions of Bird Guild Species RichnessBiophysical Structure and Environmental predictors Forest All Grassland Woodland Models developed on BBS routes Goetz et al. (forthcoming)
Regional Interactions among Ecosystem Productivity, Land Use and Canopy Structure Geographic Location Southeast US BBS sample locations, Segments, Routes Three Analysis units Stratify Disturbance History and Land Use Predictor variables LVIS Canopy cover Canopy cover by height class Land cover Percent Ag Percent developed Percent Canopy Variety of cover types MODIS GPP VCF forest Soil fertility Other biophysical Temperature Precipiation Elevation NDVI
Southeast LVIS Transect Point Segment Route BBS stop locations Three analysis units Intersection of BBS routes with LVIS acquisitions
Stop locations and BBS route buffer LVIS transect overlap Collected GPS stop location data collected for 53 of 63 BBS routes from BBS Surveyor and/or driving the route GPS
Stop locations and BBS route buffer LVIS points in red BBS stop locations buffered (Red) BBS route buffered (Yellow)
Derivation of cover at multiple canopy heights / layers Canopy cover at 10_15m
Canopy cover at 25-30m 20-25m 15-20m 10-15m 5-10m 0-5m
Summary of Findings(thus far) 1. At local scale (e.g. HBEF) bird species richness and habitat use (multi-year prevalence) can be predicted well using lidar (and multi-sensor) canopy structure • Performance of abundance predictions is species specific and first requires identification of suitable habitat • 2. At national scale bird species richness can be robustly predicted using a suite of environmental variables • Lidar canopy structure metrics are not selected as the most important predictors at this scale
Next Steps & in Progress 3. Regional scale work is ongoing using SE transect • Extending analyses across productivity, land use and disturbance gradients • Also: • Additional analysis of SE LVIS transect layers and analysis within BBS route observations • Extend work at HBEF including abundance modeling, vertical habitat use, breeding productivity