Download
1 / 17
170 likes | 353 Views
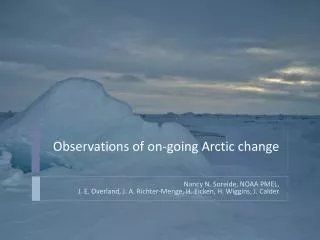
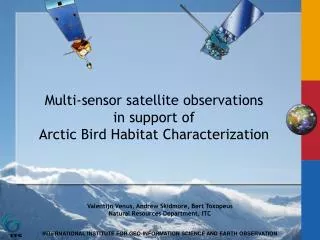
Multi-sensor satellite observations in support of Arctic Bird Habitat Characterization. Valentijn Venus, Andrew Skidmore, Bert Toxopeus Natural Resources Department, ITC. Remote sensing over Arctic's. Hostile environment, except for some birds (and satellites)

E N D
Multi-sensor satellite observations in support ofArctic Bird Habitat Characterization Valentijn Venus, Andrew Skidmore, Bert Toxopeus Natural Resources Department, ITC
Remote sensing over Arctic's • Hostile environment, except for some birds (and satellites) • Satellite constellations intersect at the poles, are there emerging advantages? • Sun-synchronous (polar-orbiting) vs. sun-asynchronous (geo-stationary) satellite platforms, how do we use both to our advantage? • What challenges we face when characterizing arctic environment using space born sensors?
Contents • Products: snow cover/duration, surface weather and atmospheric (< 300m) weather conditions, vegetation species (relation to breeding behavior), vegetation phenolgy (relation to insect abundance), permafrost, etc. • Research: validate (& improve) the above • Processing & Data distribution
Polar-orbiters at the Arctic NOAA-18 21:50 (drift -3.2 min/month) TERRA NOAA-19 21:33 (drift -2.4 min/month) “afternoon sats” 21:31 (drift -0.1 min/month) 00:00 21:25 (drift -0.2 min/month) NOAA-15 NOAA-16 18:00 06:00 17:33 (drift +4.8 min/month) “morning sats” 16:50 (drift -1.0 min/month) AQUA 12:00 Noon METOP-A 13:57 (drift -1.6 min/month) NOAA-17 13:42 (drift 0.7 min/month) FY-1D 13:23 (drift 0.3 min/month) Mean Local Times at the Ascending Node (hh:mm) Constellation as of 02 April 2009 Sun
Simultaneous Nadir Overpass (SNO) pairs of POES satellites pass their orbital intersections within a few seconds in the polar regions Occurs regularly in the +/- 70 to 80 latitude
Inter-calibration AVHRR/N18 MODIS/Aqua Sample area Reflectance Min Max Mean Stdev Band 1 AVHRR 0.4301 0.4728 0.4523 0.008894 Band 1 MODIS 0.4800 0.5401 0.5113 0.012135 For this area with 205 samples, the difference between MODIS and AVHRR is about 13%, at 99% confidence level with uncertainty +/-0.4%. Spectral differences is not the main contributor to this discrepancy, according to radiative transfer calculations. Good example of calibration traceability issue. SNO VIS/NIR example Lat=79.82, SZA=82.339996, cos(sza)=0.13, TimeDiff 26 sec, Uncertainty due to SZA diff 0.1%,
Collar data and satellite observations • GPS Telemetry Collars provide (semi) continues information on a bird’s location, irrespective of possible overlap with polar-orbiting satellite overpasses • Geo-stationary satellites observe diurnal changes of atmosphere and earth surface due to their sun-asynchronous orbit • At the cost of a lower signal-to-noise ratio because of their increased flying height (approx. 30.000 km instead of ± 800 km from the earth as with i.e. NOAA), but newer sensors provide enhanced radiometric quality
Geo-stationary at the Siberian Arctic • Meteosat-8: stand-by satellite, over 10 E, currently in "rapid scan" mode • So: sample geo-stationary imagery in space and time based a bird’s GPS collar data Coverage every 5 minutes!
Current and Future • Geo-stationary Space Segment • Meteosat-9: operational satellite, over 0 deg • Some MSG facts: • 12-channel radiometer ("SEVIRI") • 15 minute repeat cycle for full disk scans • 3 km pixel sampling distance, 1 km for HRV • Series of 4 MSG satellites planned, currently 2 operational 96 97 98 99 00 01 02 03 04 05 06 07 08 09 10 11 12 13 14 15 16 17 18 Meteosat First Generation Meteosat-6 Meteosat-7 Rapid Scanning Service (RS) (10° E) IODC Backup (67.5° E) Primary Service (0° E) IODC (57.5° E) MSG Meteosat-8 Meteosat-9 Meteosat-10 Meteosat-11 3.4° W RS (10°E) 0°
Correcting for angular effects • ITC develops triangulation algorithms to enhance satellite signals at high(er) latitudes: Three angles affect the signal received by a geo-stationary satellite sensor: 1) the solar zenith angle θ, 2) the satellite zenith angle Φ, and 3) the ‘co-scattering angle’ Ψ, between the direction towards the satellite and the sun as seen from ground. This information, which is unique for every ‘pixel’ and 5-minute satellite image, is used to correct to correct the signal for enhanced product generations (i.e. satellite estimated solar radiation).
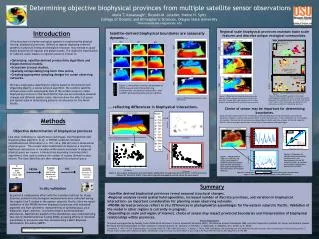
large warm water small cold ice small cold water large cold ice Example products snow cover land-surface cloud cover MODIS surface temperature (1 km resolution) SEVIRI cloud types (3 km resolution)
Surface temperature (ST) Instantaneous surface temperature derived from SEVIRI observations with the an enhanced four-channel algorithm (upper) and daily composite surface temperature derived from MODIS observations on 09/27/2004 (lower), over Europe.
Land-surface temperature (LST) Scatter plot of LST derived from the SEVIRI compared with that from the MODIS observations. Scatter plot of LST derived from a ‘new’ 4-channel SEVIRI algorithm compared with that from ground observations.
Predicting Budburst of Betula pubescens in northern Europe The optimal model predicted observed budburst very accurately: r2 = 0.92 and 0.90, and root mean square error = 6.9 days and 7.5 days for a calibration and a validation dataset, respectively. Results predict that the average budburst in northern Europe in 2080-2099 will be 20 days (standard deviation (S.D.) = 3 days), 18 days (S.D. = 4 days) or 12 days (S.D. = 4 days) earlier than in the period 1980-1999, for 3 different climate change scenarios respectively. • Stations in Norway (●), Sweden (x), Finland (○) and Germany (+) with observations of Betula pubescens (Norway and Sweden), Betula pendula (Germany), or both (Finland), as well as daily temperature.
Remotely sensed vegetation phenology & GPS collar data of Giant Panda Summarized phenology of the Fopin biosphere reserve as detected by MODIS NDVI after processing with TIMESAT. RPD (relative phenological development) is a rescaled version of the NDVI (see main text for details). The solid white lines shows the average altitudinal movement of 6 radiotracked giant pandas, thin white lines indicate the standard error of the average. Time slices of RPD during spring (1), summer (2) and autumn (3) with the positions of the radiotracked giant pandas during a 10 day period indicated by black markers.
ITC can help? • Provide access to real-time and archived data through remote data access server. Hides much of the complexity as Google Earth does for the public community: • Supported clients: web browser, IDL/ENVI, ArcGIS, IDV, matlab, Google Earth, Excel, etc. • Dedicated server needed +/- 35K EUR: HP ProLiant DL785 G6 Server • Restrict data access - research members only (username & password). • Conduct joint research