Download
1 / 31
310 likes | 420 Views
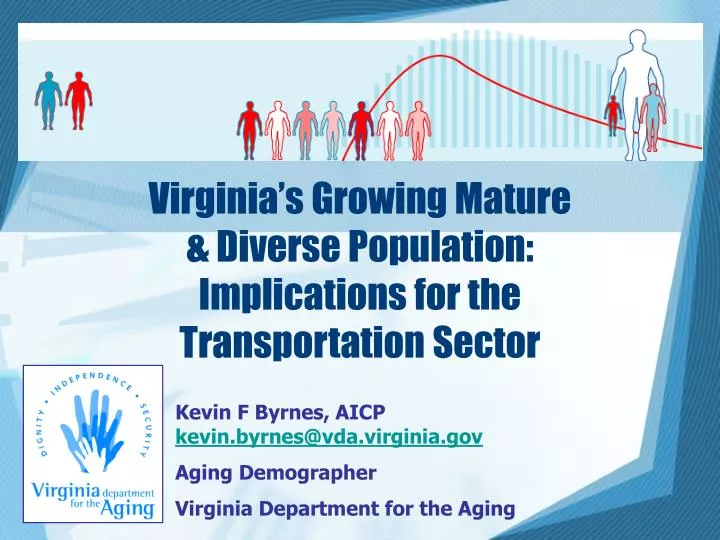
Virginia’s Growing Mature & Diverse Population: Implications for the Transportation Sector. Kevin F Byrnes, AICP kevin.byrnes@vda.virginia.gov Aging Demographer Virginia Department for the Aging. Virginia’s Aging Program: 25 Planning & Service Areas.

E N D
Virginia’s Growing Mature& Diverse Population:Implications for the Transportation Sector Kevin F Byrnes, AICP kevin.byrnes@vda.virginia.gov Aging Demographer Virginia Department for the Aging
Short-term Trends: 2000 – 20031. Migration > Natural Increase2. Uneven Sub-State Regional Growth3. Increasing Racial & Ethnic Diversity
Demographic Change: P1 = P0 + Components of Change: Natural Increase: (Births0-1 – Deaths0-1) + Net Migration: (In-Migrants0-1 – Out-Migrants0-1) + residual
Changing Age Structure: The Baby-Boom Tidal Wave • Boomers born between 1946 & 1964 • Year 2000: Boomers = Persons aged 36-54 • Year 2004: Boomers = Persons aged 40-58 • Year 2006: Boomers = Persons aged 42-60 • Year 2010: Boomers = Persons aged 46-64 • Year 2016: Boomers = Persons aged 52-70 • Year 2024: Boomers = Persons aged 60-78
What Lies Ahead?Projected US Life Expectancy Range: Expectancy Range (in Years): Low – High Projection Series NH = “Non-Hispanic” Source: National Projections Program, Population Division, U.S. Census Bureau, Wash. DC 20233. Jan 13, 2000.
Possible Impact of Aging Trends on Virginia’s Transportation Sector
In 2003, Virginia’s population age 60 & over represented 15.6% of the state total, compared to Florida’s 22.4% (1st in the Nation) • Based on national projections, Virginia’s age 60+population share(24.3%)in 2025 will be roughly comparable to Florida’s current age structure (persons age 60+ =22.4%of total in 2003).
Mean Daily Trips & Miles Forecast: Senior Drivers * SOURCE: The 2001 National Household Travel Survey, person file, U.S. Department of Transportation. (Link)
Traffic Fatalities by State Source: US Statistical Abstract: 2004-2005, Table No 1090, page 697
Work Status & Vehicle Availability for Older Virginians, 60 & over, 2000 Source: 2000 Census, PUMS Data, 5% Sample of Persons.
Contact Information: Kevin F Byrnes, AICP Demographer Virginia Department for the Aging 1610 Forest Ave, Suite 100 Richmond, VA 23229 (804) 662-7047 Kevin.Byrnes@vda.virginia.gov http://www.vda.virginia.gov/downloadable.htm