Download
1 / 65
650 likes | 807 Views
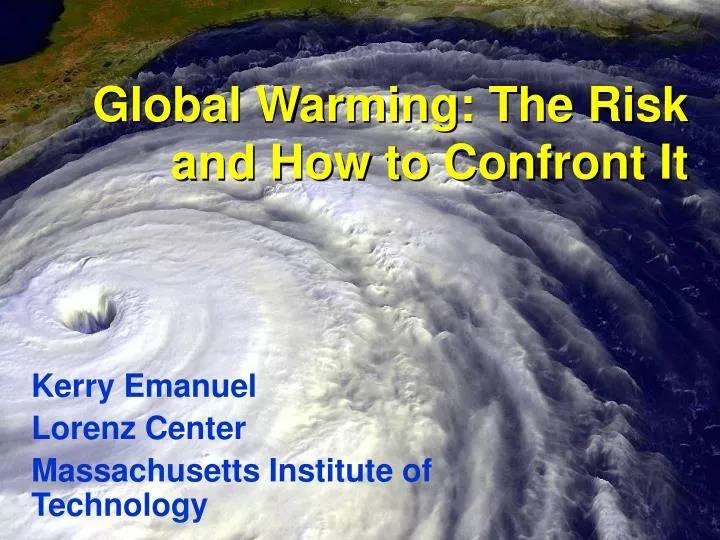
Global Warming: The Risk and How to Confront It. Kerry Emanuel Lorenz Center Massachusetts Institute of Technology. Program. Overview of Climate Change Climate Change Consequences How to Make Progress. Greenhouse Gases.

E N D
Global Warming: The Risk and How to Confront It Kerry Emanuel Lorenz Center Massachusetts Institute of Technology
Program • Overview of Climate Change • Climate Change Consequences • How to Make Progress
Greenhouse Gases The orange sliver (can you see it?) makes the difference between a mean surface temperature of -18oC and of 15oC.
Carbon Dioxide Content is Increasing Carbon dioxide concentrations from ice cores (green dots) and direct measurements (blue curve) Source: IPCC Assessment Report 5 (Chapter 6)
Total amount of heat from global warming that has accumulated in Earth's climate system since 1961, from Church et al. (2011) (many thanks to Neil White from the CSIRO for sharing their data).
Svante Arrhenius, 1859-1927 “Any doubling of the percentage of carbon dioxide in the air would raise the temperature of the earth's surface by 4°C; and if the carbon dioxide were increased fourfold, the temperature would rise by 8°C.” – Världarnasutveckling (Worlds in the Making), 1906 Latest estimate from IPCC (2013): 1.5 – 4.5 oC
MIT Single Column Model(Can be run on a laptop) IPCC Estimate: 1.5-4.5 oC
Projections Radiative Forcing of the Representative Concentration Pathways (RCPs). The light grey area captures 98% of the range in previous IAM scenarios, and dark grey represents 90% of the range. Image credit: IPCC Fifth Assessment Report
Heat Waves 2060s observations HadCM3 Medium-High (SRES A2) 2040s 2003 Temperature anomaly (wrt 1961-90) °C
High vs Low Temperature Records 2011- 2.7:1
Sherwood and Huber, PNAS, 2010 Adaptation Limit: Maximum Tolerable Wet Bulb Temperature 12o increase in mean global T
Intensity Theory Potential Intensity: Maximum sustainable surface wind speed in a given thermodynamic environment (sea surface temperature and atmospheric temperature profile)
Global Tropical Cyclone Frequency, 1980-2013 Data Sources: NOAA/TPC and NAVY/JTWC
Sea Surface Temperature Scaled to Observed Hurricane Power Dissipation, 1980-2011
Downscaling of AR5 GCMs • GFDL-CM3 • HadGEM2-ES • MPI-ESM-MR • MIROC-5 • MRI-CGCM3 Historical: 1950-2005, RCP8.5 2006-2100
Global annual frequency of tropical cyclones averaged in 10-year blocks for the period 1950-2100, using historical simulations for the period 1950-2005 and the RCP 8.5 scenario for the period 2006-2100. In each box, the red line represents the median among the 5 models, and the bottom and tops of the boxes represent the 25th and 75th percentiles, respectively. The whiskers extent to the most extreme points not considered outliers, which are represented by the red + signs. Points are considered outliers if they lie more than 1.5 times the box height above or below the box.
GCM flood height return level (assuming SLR of 1 m for the future climate ) Black: Current climate (1981-2000) Blue: A1B future climate (2081-2100) Red: A1B future climate (2081-2100) with R0 increased by 10% and Rm increased by 21% Lin et al. (2012)
IPCC 2007: Doubling CO2 will lead to an increase in mean global surface temperature of 2 to 4.5 oC. Atmospheric CO2 assuming that emissions stop altogether after peak concentrations Global mean surface temperature corresponding to atmospheric CO2 above Image source: Solomon, S., G.-K. Plattner, R. Knutti, and P. Friedlingstein, 2009, PNAS, 106, 1704-1709
“Climate change could have significant geopolitical impacts around the world, contributing to poverty, environmental degradation, and the further weakening of fragile governments. Climate change will contribute to food and water scarcity, will increase the spread of disease, and may spur or exacerbate mass migration.” • -- Quadrennial Defense Review, U.S. Department of Defense, February, 2010
Summary of Global Warming Effects on Extreme Weather • Projections of climate change effects on weather extremes vary a great deal depending on type of event and model projections • Incidence of floods increases fairly rapidly • Incidence of drought also increases rapidly
Frequency of intense (destructive) hurricanes projected to increase • Very little currently known about response of severe thunderstorms to climate change
Options for Dealing with Climate Change • Reduce emissions • gasification of coal • alternative energy– solar, nuclear, wind, etc. • Carbon capture and sequestration • Other geoengineering • technically feasible, $20-30 billion/year • side effects, e.g. reduced precipitation • Adaptation
Consider the Following Statements: • In all probability, we will successfully adapt to climate change brought about by doubling CO2. • In all probability, if you allow your 8-year-old to cross a busy street to catch her school bus, she will make it. • There is a 99% chance she will make it. • There is a 1% chance that she will not.
Estimate of how much global climate will warm as a result of doubling CO2: a probability distribution Source: 100000 PAGE09 runs Degrees C Chris Hope, U. Cambridge courtesy Tim Palmer
CO2 Will Likely Go Well Beyond Doubling Double Pre-Industrial
Annual global climate change costs (in trillions of dollars) in low emissions (purple) and business as usual (A1B; red) scenarios. The dashed lines represent the 5% and 95% probability range. Annual global climate change costs (in trillions of dollars) in low emissions (purple) and business as usual (A1B; red) scenarios. The dashed lines represent the 5% and 95% probability range.
My generation is pushing yours in front of a bus. • A bus we are driving, and which we refuse to slow down. • In all probability you will make it. • Maybe you won’t.
What Can You Do? • Conserve energy and find ways to design buildings/vehicles that use less energy • Get involved in efforts to develop clean energy and/or carbon capture and sequestration • Find ways to make it known to the generation now in power that you care about the future of Earth’s climate!