Download
1 / 25
250 likes | 269 Views
Explore the NASQAN program, its successful outcomes, and the transition to NAWQA. Learn about the objectives, sample collection process, data processing, and the extensive QA program in these water quality monitoring initiatives.

E N D
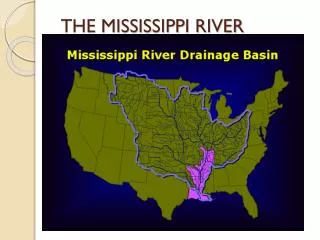
The NASQAN Program in the Mississippi River Basin R.H. Coupe
What Was NASQAN I? • Began in the early 70’s and continued through the mid 90’s • Goal : to provide nationally comparable information on water quality • At its peak extent, it included sampling at over 500 stations and was funded at $5 million annually
Was the Program Successful? Yes, the data has been used in a variety of ways: • To assess trends in water quality over time • Used extensively by States in their 305(b) assessments • To determine the flux of nutrients into the Gulf of Mexico and to determine sources areas for these nutrients within the Mississippi River Basin
What Happened to NASQAN I? • Program objectives could not be achieved with available funding • Inadequate QA/QC program • Constituents measured did not include important chemicals, such as pesticides and trace elements • Relation between NAWQA and NASQAN unclear
NAWQANational Water Quality Assessment • Begun in the early 90’s • Seeks to identify, explain, and determine status and trends in WQ conditions • Includes on a rotational basis >40 basins with a basin size of 10,000 to 100,000 square miles • Many original NASQAN stations were contained within NAWQA study units
Big Rivers • Mississippi River (1.2 million square miles) • The Great Lakes/St. Lawrence (396,000) • Rio Grande (336,000) • Yukon (328,000) • Columbia (258,000) • Colorado (250,000) • Next largest river 20% less than Colorado
NASQAN II Objectives • Provide an ongoing characterization of concentrations and flux of chemicals and sediment in the Nation’s largest rivers • Determine source areas for these materials • Assess the effect of human influences on the observed concentrations and flux
NASQAN Sample Collection • Sampling frequency varies among stations, normally 6 to 15 samples annually, with a possibility of more during extreme high flows. • The number of samples depends on the expected variability of water quality at the site. Since this is a flux based program, more samples are allocated during expected high flows.
NASQAN Samples Are: • Collected with appropriate equipment using standard and documented procedures • Depth and width integrated and velocity weighted • EDI or EWI with 3 to 10 verticals • Isokinetic samplers are used
Physical and Chemical Measurements Include: • Field parameters, T, SC, turb., DO, pH, alk. • Discharge • Suspended sediment and percent <63 um • Nutrients • Major ions • Trace elements – dissolved and SS • Pesticides – water soluble
PROCESSING : chamber used to prevent contamination. Here filtering for trace elements with 0.45 um capsule filter and masterflex pump with Teflon tubing.
Processing for pesticides using a 0.7 um nominal pore size baked glass fiber filter
All WRD Field Offices have something comparable to Montana’s mobile laboratory for processing in the field
Extensive QA Program • Well defined protocols for sampling, sample processing, chemical analysis and data review • QC program includes: • All field personnel participate in the NFQA program • Evaluation of quality control samples, including field blanks, replicates, and field-matrix spikes • On site inspections
Fluxes are computed using the rating curve method The rating curve equation f(Qi) has the form: ln(L) = ao + a1ln(Q) + a2ln(Q)2 + a3sin(t) + a4cos(t) + a5t
NASQAN Products • Data • Online as soon as it is received by District • Interpretative • Presentations at meetings and conferences • Special volume of Hydrological Processes • Yield maps just published online for 1995-98
2001 Mississippi State Soccer Champions, Division III, U14 Girls