Download
1 / 42
420 likes | 525 Views
Explore the genetic legacy of past human populations to better understand human evolution, demography, and relationships within the Homo genus. Statistical evaluation of evolution models using genetic data. Utilizing a semi-spatial approach and approximate Bayesian computations for robust parameter estimations. Computational issues, demographic simulations, and spatial expansion modeling discussed.

E N D
Tracking the genetic legacy of past human populationsthrough the grid Nicolas Ray University of Bern / CMPG (University of Geneva & UNEP/GRID-Europe) ECSAC09, Veli Lošinj, August 26th 2009
Adapted from Cavalli-Sforza & Feldman, 2003 Human migrations [12,000] [55,000] Homo sapiens sapiens
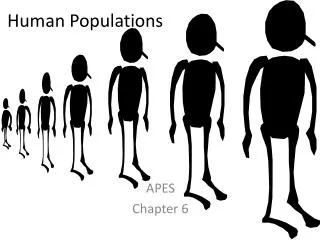
1. Better understand human evolution • Origin of modern human (when, where, how many?) • Relationship with other members of the Homo genus • 2. Distinguish between the effect of demography and those of selection (biomedical applications)
Observed patterns of genetic diversity in contemporary populations A complex past demography fluctuation in effective pop. size substructure migrations Gene-specific factors mutations recombination selection
Statistical Evaluation of Alternative Models of Human Evolution Nelson Fagundes, Nicolas Ray, Mark Beaumont, Samuel Neuenschwander, Francisco Salzano, SandroBonatto, and Laurent Excoffier. 2007. PNAS, 104: 17614-17619 • 50 loci in non-genic regions (Chen and Li, 2001) • About 500 bp each, 24,425 bp in total • 30 individuals: 10 Africans, 8 Asians, 12 Amerindians • Chimpanzee sequenced to get estimation of mutation rates assuming 6 My divergence time
ASIG ASIG ASEG ASEG AFRIG AFRIG AFREG AFREG AS AF AM AS AS AS AS AF AF AF AF AS AS AM AM AM AM AF AF AM AM MREBIG MREBIG MREBEG MREBEG MRE1S MRE1S MRE2S MRE2S AS AS AS AS AS AS AS AS AF AF AF AF AF AF AM AM AM AM AM AM AF AF AM AM Models African replacement Assimilation time Multiregional evolution
Asia Africa Americas Simulations Coalescence theory A retrospective model of population genetics Traces all copies of a gene in a sample from a population to a single ancestral copy shared by all members (MRCA) Assumes no recombination, no selection Time
Summary statistics • Within population: • S, p • Between populations • Pairwise FST • Global FST • Globally • S, p ACCTAGTACAATCGGTAATGCCATTGGT Modèle de mutation Mutation Simulated genealogy TCCTTGTA…ATTGGT ACCGAGTA…GTTGGT
Approximate Bayesian Computations (ABC) The rejection-sampling approach: • Calculate summary statistics (S) for observed data sets • Draw parameter values φ’from prior distributions, and use them to simulate data • Calculate summary statistics (S’) on the simulated data set and compare them to the observations: δ =||S - S’|| (Euclidean distance) • Accept φ’ ifδis arbitrarily small, otherwise reject sample • The ABC approach (Beaumont et al. 2002) • Modification: a local regression is added within the set of accepted φ’ values
Computational issues Computer clusters 1-10 mio. UBELIX (>500 nodes) Zooblythii (~40 nodes)
For ABC, 5 mio. demographic simulations are necessary to obtain robust parameter estimations Each demographic simulation is followed byn genetic simulations (n = num. of loci) Example 8 simple models, 50 loci, 30 individuals 2 CPU-year
ASIG ASIG ASEG ASEG ASEG ASEG AFRIG AFRIG AFREG AFREG AFREG AFREG AS AF AM AS AS AS AS AS AS AF AF AF AF AF AF AS AS AS AS AM AM AM AM AM AM AF AF AF AF AM AM AM AM 0.091 0.909 0.042 0.958 MREBIG MREBIG MREBIG MREBIG MREBEG MREBEG MRE1S MRE1S MRE2S MRE2S AS AS AS AS AS AS AS AS AS AS AF AF AF AF AF AF AF AF AM AM AM AM AM AM AM AM AF AF AM AM 0.422 0.048 0.069 0.461 Relative probabilities of models of human evolution African replacement Assimilation 0.781 0.001 Multiregional evolution 0.218
AFREG AM AS AF Out-of-Africa time 51.1 Kya (40.1 – 70.9) Americas colonization time Speciation time 10.3 Kya (7.6 – 15.9) 142 Kya (104 – 186)
Adapted from Cavalli-Sforza & Feldman, 2003 A complex demography [10,000] demographic and spatial expansions [55,000] population bottlenecks secondary contacts population isolation fast migration events
Carrying capacity low high From environment to demography Spatial resolution: 100 km
From environment to demography Friction low high
Cell or deme Pop. size time Demographic simulations stepping-stone model (cellular automata)
SPLATCHE SPatiaLAnd Temporal Coalescences in Heterogeneous Environment (http://cmpg.unibe.ch/software/splatche)
Vegetationmaps Present potential vegetation Taking into account altitudes Expert system present potential Ray et Adams. 2001. Internet Archaeology 11 Vegetation at the Last Glacial Maximum Last Glacial Maximum
Demography and spatial expansion Population density
Dynamicvegetation intermediate PP LGM
Computational issues A fully spatially-explicit model using 500 loci in 800 individuals: 10 CPU-years Adding long-distance dispersal: 20 CPU-years
SPLATCHE on the grid • early 2005: joined the Biomed VO of the EGEE project • mid 2005: tested on GILDA test bed, and deployed on the Grid • since late 2005: testing and improvement • since mid 2006: production mode and optimization
GRID Statistical tools Posterior distribution of demographic/genetic parameters of interest Use of SPLATCHE on the grid N simulations • Independent simulations: • the more CPUs, the better • job failures are not that bad
Submission time multi-threaded application using up to 30 RBs (used for the WISDOM project) Fetching time of job outputs in-house multi-threaded solution for checking status and getting outputs GRID Optimizations Reduction of the number of simulations (Daniel Wegmann) By MCMC. Promising results (~10 times less sims) 5 mio. simulations
Geographic origin of human dispersal Ray et al. (2005) Genome Research
Mutations surfing during a range expansion • Some mutation can travel with the wave of advance • New mutations can reach high frequencies • More pronounced in small populations Klopfstein, Currat and Excoffier (2006) MBE 23(3): 482-490
Selection ? Currat, Excoffier, Maddison, Otto, Ray, Whitlock and Yeaman (2006) Science 313:172a (2005) Science 509 (5741)
Interactions among populations Interaction between modern humans and Neanderthals in Europe Currat & Excoffier(2004), PLoS Biol.
Cane toad invasion in Australia Estoup, A., Baird, S. J. E., Ray, N., Currat, M., Cornuet, J.-M., Santos, F., Beaumont, M. A. and L. Excoffier. Combining genetic, historical and geographic data to reconstruct the dynamics of the bioinvasion of cane toad Bufo marinus. In prep