Download
1 / 31
310 likes | 481 Views
Mapping Out The Food We Eat Bill Hegman Middlebury College whegman@middlebury.edu. Special Topics in Spatial Analysis and Mapping: 2008. Mapping Out the Food We Eat. Presented by Bill Hegman, Middlebury College October 30, 2008. NITLE – Special Topics in Spatial Analysis.

E N D
Mapping Out The Food We EatBill HegmanMiddlebury Collegewhegman@middlebury.edu Special Topics in Spatial Analysis and Mapping: 2008
Mapping Out the Food We Eat Presented by Bill Hegman, Middlebury College October 30, 2008 NITLE – Special Topics in Spatial Analysis
Goals of the Project (started in 2006) Mapping Out the Food We Eat • Understand how our individual and institutional food choices play out environmentally, economically, socially, and politically. • Create a useful educational resource that can be used across the curriculum. • Develop a stunning interactive representation of just how vast the global food system really is. • Create an open source tool – hence Google Earth This is one of the first projects of its kind—using GIS to track and visualize the supply chain from farm to college dining plate.
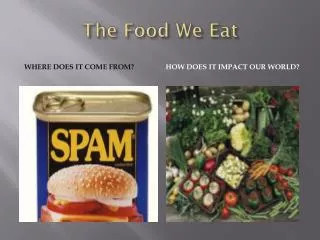
Current Initiatives Mapping Out the Food We Eat • Food Mapping: the narrative – where does our food come from? • Really a network mapping problem. Could be applied to any network (I’ll show some examples later) • First - How do we define local? • Vermont or within 100 Miles • and • If the product is produced locally using ingredients or the majority of the labor is local. • How much do we buy locally? • Let’s find out.
Really – this was the majority of the work (7+ weeks) Compiling Existing Purchase Records and Locations (June 2006 – June 2007)
Frozen Food Ice Cream Paper Products Non-Alcoholic Alcoholic Groceries Meat Bakery Produce Dairy Total: $3,992,604.19
Then – we proceed to map the food network. • Criteria: • Popular • Relatively easy to track ingredients. • Variety
Each link required research. Some links were easier to track down than others.
Sometimes it was difficult to tell the mode of transportation – so we used straight lines.
Some of the links are approximations. The Durum wheat triangle was difficult to define exactly. It’s difficult or impossible to track wheat back to a particular farm or field. Alberta Saskatchewan Manitoba Montana North Dakota Minnesota South Dakota
Building the Map in Google Earth Each “node” in the network has a point and associated text
Each new node has a line connecting to the previous node. The line represents a road or other transportation connection
Each node is its own Google Earth KML file and it contains several elements Point with associated description (typed or cut and paste) A line that represents the travel path
Creating the Links in KML This line opens the new KML file (node). The whole line/reference has to be inserted manually This creates the underlined hyperlink in the balloon text box. Burlington Foodservice (BFS) provides over half of the food bought by Middlebury College. <DIV>The breaded chicken for Chicken Parmesan is mainly <A href="http://geography.middlebury.edu/applications/Food_Mapping/Tyson_ChickParm.kml#Rogers;balloonFlyto">Tyson</A> breaded chicken. </DIV> This name has to be unique and is tied back to a position “tag” in the Tyson_ChickParm KML code. This part flies to the point in Tyson_ChickParm.kml and opens the description balloon.
KML Code (Tyson_ChickParm.kml) This name has to be added manually to the Tyson_ChickParm.kml. </Placemark> <Placemark id = "Rogers"> <name>Tyson</name> <description><![CDATA[<DIV>Rogers, AR</DIV> The breaded chicken breast fillet for Chicken Parmesan at the Middlebury College dining halls get shipped from its processing plant in Russellville, AR to a distribution center in Russellville or here in Rogers, AR. Rogers is also home to two chicken further-processing plants, The Pork Group headquarters, and The Pork Group Eastern Operations headquarters. Tyson works with over 6,800 independent contract farms across the country to raise chicken on Tyson-regulated growout farms. Tyson has hundreds of processing plants, feed mills, hatcheries, and growout farms across the globe. To see where all of Tyson's poultry farms and facilities are, click <A href="http://geography.middlebury.edu/applications/Food_Mapping/Tyson_ChickALL.kml">here</A>.]]></description> <LookAt> <longitude>-83.64913943905169</longitude> <latitude>39.88424230229439</latitude> <altitude>0</altitude> <range>2204367.022902698</range> <tilt>-1.237290498659621e-014</tilt> <heading>1.172681567813986e-014</heading> <altitudeMode>relativeToGround</altitudeMode> </LookAt> <styleUrl>#msn_T_copy3</styleUrl> <Point> <coordinates>-94.1247,36.3335,0</coordinates> </Point> </Placemark>
All these locations were provided as addresses on the Tyson website. They were geocoded using Batchgeocode.Com and then added to Google Earth. This took maybe a few hours to compile.
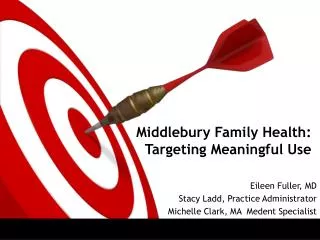
How are we Using the Food Mapping? Mapping Out the Food We Eat • As a catalyst for discussion around College purchasing decisions. Three or four meeting so far that include the Director of Dining Services, the Director of Purchasing, students, Environmental Council and Faculty. • As a component of classes. The current class is John Elders class on local food (ES class). Also part of Environmental Economics (see other related projects). • As a catalyst around the Colleges carbon neutral initiative and commitment. Howard Woodin Colloquium Series http://www.middlebury.edu/academics/ump/majors/es/events/woodin/ • Linked to the Dining Services menu page that students access daily. http://www.middlebury.edu/campuslife/dining • As part of outreach/student learning initiatives. This one has the most potential (other related projects are discussed below)
Why did we choose Google Earth? Mapping Out the Food We Eat • Readily available • Free • Easy to use – especially for kids • Current imagery and data including regular updates • Accessible and easy to understand documentation • Lots of examples of applications, and active application development.
Enhancements Mapping Out the Food We Eat • Enhance existing networked meals to include more “obscure ingredients” • Tyson breaded chicken fillets contain over 20 ingredients – a dozen of which can be derived from corn*: • Corn fed chicken • Modified cornstarch • Mono, di, triglycerides • Dextrose • Lecithin • Chicken broth • Yellow corn flower • Cornstarch • Vegetable shortening • Partially hydrogenated corn oil • Citric acid * Based on information presented in The Omnivore’s Dilemma by Michael Pollan, 2006
Enhancements (cont) Mapping Out the Food We Eat • There are also completely synthetic ingredients derived from petroleum*: • Sodium aluminum phosphate • Mono calcium phosphate • Sodium acid pyrophosate • Calcium phosphate • Expand on the meals – focus on salad bar • Consider moving the content to Google Maps • or • Link the Google Earth Maps to a browser (there is now a plug in available for Firefox and Internet Explorer) * Based on information presented in The Omnivore’s Dilemma by Michael Pollan, 2006
What’s Next with this Food Mapping Initiative? Mapping Out the Food We Eat • Develop ties with other organizations and institutions • Shelburne Farms – will sponsor an internship to help develop • a curriculum module (summer 2009) • Looking for other sponsors (Teresa Vaughn, Lincoln Elementary, Washington state) • Networking with other Universities(UVM - Amy Trubek and graduate students) • Attend conferences and network(Terra Madre and educational conferences) • Identifying and working with other local non-profits(VFN, VTFEED, NOFA)
Vermont Fresh Network (VFN) Partners Map Linking their database to Google Maps. Completed as part a 2008 summer internship by Jack Cuneo.
The “links” for each partner can also be shown. In this example, all the farms that supply the Inn at Baldwin Creek are shown and described. This map application will be up on the VFN website sometime late fall 2008.
What’s Next with this Food Mapping Initiative (cont)? Mapping Out the Food We Eat • Continue to incorporate ideas into classes at Middlebury(Econ, ES, Geography) • Environmental Economics and independent project • Carbon Footprint • http://geography.middlebury.edu/data/food_mapping/foodmappingFINAL.doc • http://www.nativeenergy.com/pages/travel_calculator/30.php • Local Multiplier Effect • http://geography.middlebury.edu/data/food_mapping/Geography_and_the_Multiplier.doc • Continue work with Dining Services • Maintain local vendors map done with Google Maps • http://geography.middlebury.edu/applications/Food_Mapping/Local_Vendors/Google_Maps/LocalVendorsMap.html • Closed Food Loop Mapping – what happens to food when it get to Middlebury? • http://geography.middlebury.edu/data/food_mapping/Primary_Food_Deliveries.kml
GIS and Correlation/Causation Speaker: Diana Sinton, University of the Redlands Date: Tuesday, November 18th, 4pm EST The Elephant in Adolescence: Managing & Supporting GIS Speaker: Betsy Reese, Bryn Mawr College Date: Tuesday, December 16th, 4pm EST Special Topics in Spatial Analysis and Mapping: 2008