Download
1 / 1
10 likes | 174 Views
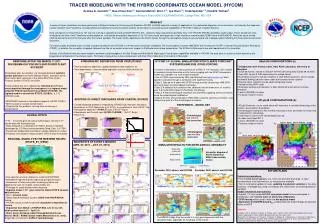
TRACER MODELING WITH THE HYBRID COORDINATES OCEAN MODEL (HYCOM) Zulema D. Garraffo 1,2 , Hae-Cheol Kim 1,2 , Avichal Mehra 2 , Bin Li 1,2 , Ilya Rivin 1,2 , Todd Spindler 1,2 , Hendrik Tolman 2 1 IMSG, 2 Marine Modeling and Analysis Branch/EMC/NCEP/NWS/NOAA, College Park, MD, USA. Abstract

E N D
TRACER MODELING WITH THE HYBRID COORDINATES OCEAN MODEL (HYCOM) • Zulema D. Garraffo1,2, Hae-Cheol Kim1,2, Avichal Mehra2, Bin Li1,2, Ilya Rivin1,2, Todd Spindler1,2, Hendrik Tolman2 • 1IMSG, 2Marine Modeling and Analysis Branch/EMC/NCEP/NWS/NOAA, College Park, MD, USA Abstract A series of tracer simulations has been performed at National Centers for Environmental Prediction (NCEP) at NOAA aimed at a variety of applications, from estimated dispersion of contaminants, motivated by the Japanese nuclear accident near Fukushima, to biogeochemical modeling for future ecosystem studies. All simulations use existing tracer capabilities of HYCOM in regional or global domains. Daily simulations for Fukushima Cs-137 are now running in operational mode at NCEP (RTOFS_ET), nested to daily nowcast/forecast fields from 1/12o HYCOM (RTOFS_GLOBAL) model output. These simulations were initialized at the time of the Fukushima nuclear explosion, and include atmospheric deposition of Cs-137 and coastal discharge from a high resolution coastal model (ROMS done at NOAA/NOS). Almost all tracer moved offshore before the end of the first year after the nuclear accident. The tracer initially deposited in the Pacific Ocean through the atmosphere slowly moves eastward and to deeper waters following the three-dimensional ocean circulation. For tracer studies at climate scale, a series of global simulations with HYCOM at 1/4o resolution have been completed. The first simulation covered 1993-2009, with forcing from NCEP’s Climate Forecast System Reanalysis (CFSR). A radiation flux correction is applied obtained from the un-corrected model error respect to Pathfinder sea surface temperature. The El Niño/La Niña events are well reproduced in this simulation. A series of simulations have also been started to estimate nutrient budgets in the Gulf Stream and Mid Atlantic Bight region. Using tracer capabilities available in HYCOM, the work aims to monitor nutrient dynamics and biogeochemical features in the chosen region. This study is being done in close collaboration with Horn Point Laboratory of University of Maryland. • GSa0.08 CONFIGURATIONS (a) • Collaboration with Victoria Coles, Horn Point Laboratory, University of Maryland • GSa0.08 domain, nested to Global 1/12o HYCOM using daily GLBa0.08 archives • Uses NRL source 2.2.36 implemented to embed tracers • Boundaries chosen to include variations in Gulf Stream positions; and to include southward flowing Labrador open ocean and coastal current systems • Passive tracer (salt-like) can be spatio-temporally traced • Vertical mixing (KPP used) • Barotropic nesting and relaxation to daily GLBa0.08 archives but no tracer relaxation • Levitus (WOA09) for tracer • Forecast mode for interior • ATLg0.08 CONFIGURATIONS (b) • ATLg0.08 domain, run as stand alone with relaxation to monthly climatology at the northern and southern boundaries • Climatological forcing (era 40) monthly mean plus 6 hour anomalies for winds only • Initialized from climatology • Initial state is year 8 of the climatological spin-up • No tides and closed BC’s • Levitus (WOA09) for tracer • Forecast mode for interior • RESPONSE AFTER THE MARCH 11 2011 FUKUSHIMA-DAI’ICHI NUCLEAR POWER PLANT ACCIDENT • Immediately after the accident, we released idealized synthetic surface particles in the North Western Pacific, advected by the three meter depth velocities of the global Real Time Ocean Forecast System (RTOFS) simulation. • This procedure was soon replaced by following Cs-137 as a tracer deposited through the atmosphere, in a regional model using the HYbrid Coordinate Ocean Model (HYCOM). The regional model is nested into RTOFS_GLOBAL, a 1/12° HYCOM model. • NCEP/NWS focused on atmospheric deposits (HYSPLIT-NSC) • NOS focused on coastal contamination • Combine the two products, for long-term monitoring of contamination • ATMOSPHERIC DEPOSITION FROM HYSPLIT3-NSC • Total atmospheric deposition, spatial distribution after explosion (a) • Time dependence of accumulated deposition over the whole domain (b) • ADDITION OF DIRECT DISCHARGE FROM COASTAL SOURCE • Coastal discharge added by interpolating a ROMS high resolution simulation (Lanerolleet al. 2012; Masumoto et al. 2012), re-normalized to total 4.5X10¹⁵Bq • Atmospheric deposition (HYSPLIT) only; 5.4X10¹⁵Bq (a) • Atmospheric and Coastal input (HYSPLIT+ROMS) ; 10x1015Bq (b) • Dilution (c) • HYCOM 1/4o GLOBAL SIMULATIONS WITH CLIMATE FORECAST SYSTEM REANALYSIS (CFSR) FORCING • A series of simulations is being carried out at EMC at 1/4o resolution, with interest in seasonal climate time scale and for future coupling with the NCEP atmospheric model as a member of a multi-model ensemble • Use of CFSR as processed by NRL and obtained from www.hycom.org. Wind speed is corrected through a correlation with QuikSCAT winds. • Step 1) Spin-up for 6 years with CFSR forcing (monthly climatology 1993-2009, with wind stress and wind speed anomalies). • Step 2) A radiation flux correction was obtained from the mean error of monthly year 5-6 model SST respect to Pathfinder climatology. • Step 3) A new climatological simulation was started by applying the flux correction since the climatological initialization. • Step 4) An inter-annual simulation 1993-2009, using the same flux correction, was started from year 6 of the climatological simulation (a) (b) April 21 Total: 5.4 1015Bq over ocean March 11 PATHFINDER – MODEL SST August February • GLOBAL RTOFS • 1/12° horizontal grid, 32 vertical hybrid layers, density in σ²* coordinates with thermobarocity. • Daily initialization is obtained from NAVO, based on NCODA (developed by U.S.Navy) and assimilating Temp, Saln, U,V, SSH. • Forced with Global Data Assimilation System (GDAS) for 2-days of hindcast, and Global Forecast System (GFS) 6 days of forecast. • REGIONAL MODEL FOR THE WESTERN PACIFIC • (RTOFS_ET_WPAb) • First operational ocean dispersion model at NCEP/NWS • Available at http://www.polar.ncep.noaa.gov/global/tracers • Component of future ecosystem modeling systems and applications such as oil spills, radionuclides, etc • Prototype for quick disaster/event response • Regional model, 1/12°grid, nested to Global RTOFS nowcast daily archives. • Run in forecast mode • Global Data Assimilation System (GDAS from NCEP/NOAA) forcing • HYCOM source 2.2.36tr forced with atmospheric deposition of tracers • Deposition from NOAA’s HYSPLIT-NSC (v.3) for Cs-137, whole period (march 12 ~ April 21) • Direct ocean discharge added through National Ocean Service (NOS’) ROMS coastal model (Masumoto et al., 2012), at April 26, normalized to 4.5PB of total discharge Climatological run without flux correction (b) (a) (c) (b) Climatological run with flux correction (a) 1 2 SNAPSHOTS OF EVERY 6 MONTHS (APR. 27, 2011 – OCT. 27, 2012) SIMULATED RESULTS FOR INTER-ANNUAL VARIABILITY (0m) El Niño 2009 La Niña 2007 Hovmuller diagram of Pacific Equatorial SSHA from monthly means El Niño 2002-03 El Niño 1997-98 South America Indonesia (zoom) NIÑO3.4 December 2007, observ. and HYCOM December 2009, observ. and HYCOM • FUTURE PLANS • Fukushima simulations: • Include extra tracer sources, e.g., from river and land discharge, or input concentrations from observations, as they become available • Test of incremental update of tracer, updating the physical variables to the daily nowcasts, and tracers by using covariances with observation-constrained physical variables • Global simulations and nutrients: • A global 1/4o with simple N-P-Z-D ecosystem model is being developed in collaboration with Victoria Coles at University of Maryland • CFSR forcing will be used to drive the bio-physical model • Application of SeaWiFS based Kpar collaborated with Sudhir Nadiga and Avichal Mehra at NCEP • References • Lanerolle, L.W., R. Patchen, A. Mehra, H. Tolman, and J. Cortinas, 2012. Numerical modeling of the fate of oceanic radionuclides, Ocean Science Meeting, Salt Lake City, Utah, U.S.A. • Masumoto, Y, Y. Miyazawa, D. Tsumune, T. Tsubono, T. Kobayashi, H. Kawamura, C. Estournel, P. Marsaleix, L. Lanerolle, A. Mehra, and Z. Garraffo, 2012. Oceanic dispersion simulations of 137Cs released from the Fukushima Daiichi Nuclear Power Plant. Elements, vol 8, pp 207-212. (400m) (700m) (sections) 1 The NIÑO3.4 index from the model is in very good agreement with the observed index, especially for the phase of the events. The NIÑO3.4 index from the model is in very good agreement with the observed index, especially for the phase of the events 2