Download

1 / 13
130 likes | 151 Views
Learn about the application of HYCOM in eddy-resolving global ocean prediction efforts by NRL, Florida State, U. of Miami, and more. Explore operational systems and forecasting statistics.

E N D
Part of HYCOM/GODAE project sponsored by the National Ocean Partnership Program Application of HYCOM in Eddy-Resolving Global Ocean Prediction Community Effort:NRL, Florida State, U. of Miami, GISS, NOAA/NCEP, NOAA/AOML, NOAA/PMEL, PSI, FNMOC, NAVOCEANO, SHOM, LEGI, OPeNDAP, UNC, Rutgers, USF, Fugro-GEOS, Orbimage, Shell, ExxonMobil Presented by Harley Hurlburt Naval Research Laboratory Stennis Space Center, MS USA International GODAE Steering Team Meeting St. Johns, Newfoundland, Canada 7-9 August 2007
U.S. Navy Present and Planned Global Ocean Prediction Systems OP = operational 1 High vertical resolution for mixed layer prediction. Assimilates SSH from NLOM via T and S synthetic profiles. Web page http://www.ocean.nrlssc.navy.mil/global_ncom 2 Web page http://www.ocean.nrlssc.navy.mil/global_nlom 3Running in real time at NAVO. 4 Under the National Ocean Partnership Program (NOPP), 1/12 Atlantic HYCOM demo is running in near real-time. Includes the Mediterranean Sea. 5Results at http://www.hycom.org (100Tb LAS server at FSU)
Results from Real-Time 1/12 Global HYCOM with NCODA Data Assimilation Sea Surface Height (SSH) in cm NW Pacific SSH zoom on 12 Mar 2007 NAVOCEANO operational analysis of the Kuroshio front based on satellite AVHRR imagery is overlaid black segments are based on imagery > 4 days old Global SSH on 23 Mar 2007 Gray areas are ice covered
NRL Coupled Ocean Data Assimilation (NCODA) Ocean obs Sequential Incremental Update CycleAnalysis-Forecast-Analysis SST: GAC/LAC MCSST, GOES, Ship, Buoy Profile: XBT, CTD, T & S profiling Floats (ARGO), Fixed Buoy, Drifting Buoy Altimeter SSHA SSM/I Sea Ice Ocean data QC Innovations Ocean data Analysis 3D MVOI & Cooper-Haines Increments Ocean model HYCOM Forecast Fields Prediction Errors First Guess MVOI - simultaneous analysis 5 ocean variables temperature, salinity, geopotential, velocity (u,v)
1/12º Global HYCOMSSH and surface drifters in the Kuroshio Region
1/12º Global HYCOMSSH and surface drifters in the Kuroshio Extension
Forecast Verification Statistics from 1/12 Global HYCOM 1.0 0.9 World Ocean Gulf Stream Persian Gulf 0.8 0.7 Median SSH anomaly correlation 1.0 Equatorial Pacific 0.9 Kuroshio Taiwan 0.8 0.7 0.6 0 10 20 30 0 10 20 30 0 10 20 30 Forecast length (days) Atmospheric analysis forcingoperational forcing*persistence 16 Forecasts included in statistics * Operational forcing reverts toward climatology at the end of the atmospheric forecast.
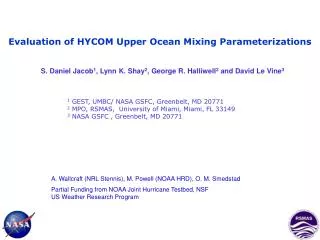
Model Evaluation: Regional NCOM NCOM CCS 9 Km NCOM Regional (CCS) with SeaWifs Chlorophyll J. Kindle (NRL)
Model Evaluation: Tide Gauges Regional NCOM: Forced by NCOM and HYCOM Global NCOM and HYCOM Boundary values from Correlation HYCOM .86 NCOM .75 Model Correlation HYCOM .87 NCOM .77 Global HYCOM and NCOM nest represent Coastal Kelvin Wave Pulses More Accurately J. Kindle (NRL)